Systematic sampling
Systematic sampling selects every \(k\)-th unit from an ordered list, starting from a randomly chosen position within the first interval. It is simpler to implement than simple random sampling and can be more efficient when the list is well-ordered, but it is vulnerable to hidden periodicity in the population.
Procedure
Given a population of size \(N\) and a desired sample of size \(n\):
Step 1: compute the sampling interval:
\[k = \left\lfloor \frac{N}{n} \right\rfloor\]
Step 2: choose a random starting point \(r\) uniformly from \(\{1, 2, \ldots, k\}\).
Step 3: select units \(r,\; r+k,\; r+2k,\; \ldots,\; r+(n-1)k\).
Every unit has selection probability \(1/k \approx n/N\), so systematic sampling is a probability method. However, only \(k\) distinct samples are possible (one for each starting point), unlike SRS where \(\binom{N}{n}\) samples are possible.
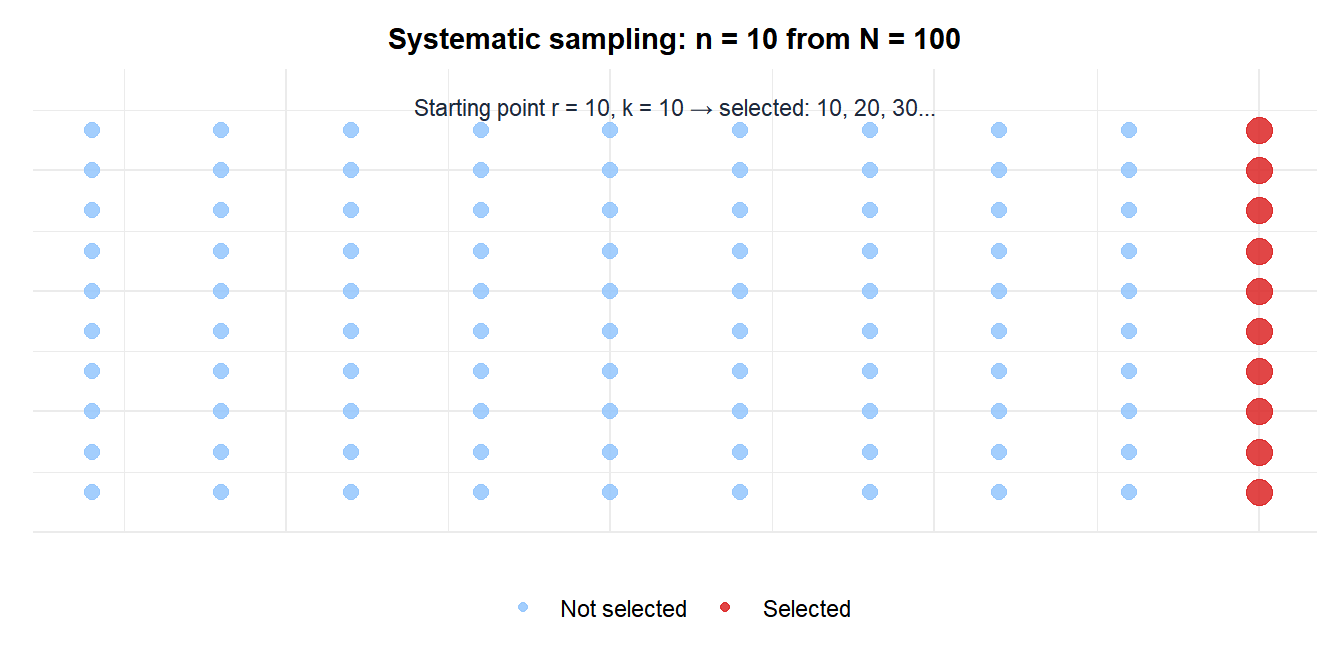
The selected units (red) form a regular pattern: one per column. The random starting point \(r\) determines which row is selected in each column.
Efficiency vs SRS
Systematic sampling is more efficient than SRS when the list is ordered by the variable of interest, because the sample is automatically stratified across the ordering. For a population ordered by age, income, or size, systematic sampling ensures the sample spans the full range.
The variance of the systematic sample mean \(\bar{y}_{sys}\) satisfies:
\[\text{Var}(\bar{y}_{sys}) \leq \text{Var}(\bar{y}_{SRS})\]
when the intraclass correlation within intervals is positive (units within the same interval are similar). In practice, any reasonable ordering of the list (alphabetical by name, chronological by date, sequential by production order) tends to make systematic sampling at least as efficient as SRS.
Example
A hospital wants to audit 50 patient records from a database of 500 cases listed in chronological order of admission.
\[k = \lfloor 500/50 \rfloor = 10\]
A random number between 1 and 10 is drawn: say \(r = 4\). The selected records are: 4, 14, 24, 34, …, 494. The audit team processes every 10th record in admission order, ensuring coverage across the entire year.
A factory produces 8,000 components per shift. The quality team needs to inspect 80 units. Sampling interval: \(k = 8000/80 = 100\). A random starting point \(r = 37\) is drawn. Units 37, 137, 237, …, 7937 are inspected.
This is practical because the inspector simply counts units on the line rather than generating 80 random numbers and searching for specific units. The result is equivalent to SRS in terms of selection probability, and the regular spacing ensures defects occurring at any point in the shift are detectable.
The periodicity problem
⚠️ Periodicity in the list can severely bias systematic samples
If the list has a periodic structure with the same period as \(k\), the sample will consistently hit the same phase of the cycle, producing a biased and unrepresentative sample.
Classic examples:
- Production line: inspecting every 8th component when the machine produces one defective unit every 8 units will either always include or always miss the defect, depending on the starting point.
- Weekly scheduling: if \(k = 7\) and the list is ordered by day, every selected unit falls on the same weekday. A Monday-only sample misses weekend effects.
- Apartment buildings: if \(k = 10\) and floors have 10 apartments numbered sequentially, systematic sampling always hits the same position on each floor (e.g., always the corner apartment).
Detection: plot the list values against their index before sampling and look for regular patterns. If periodicity is suspected, use SRS or stratified sampling instead.
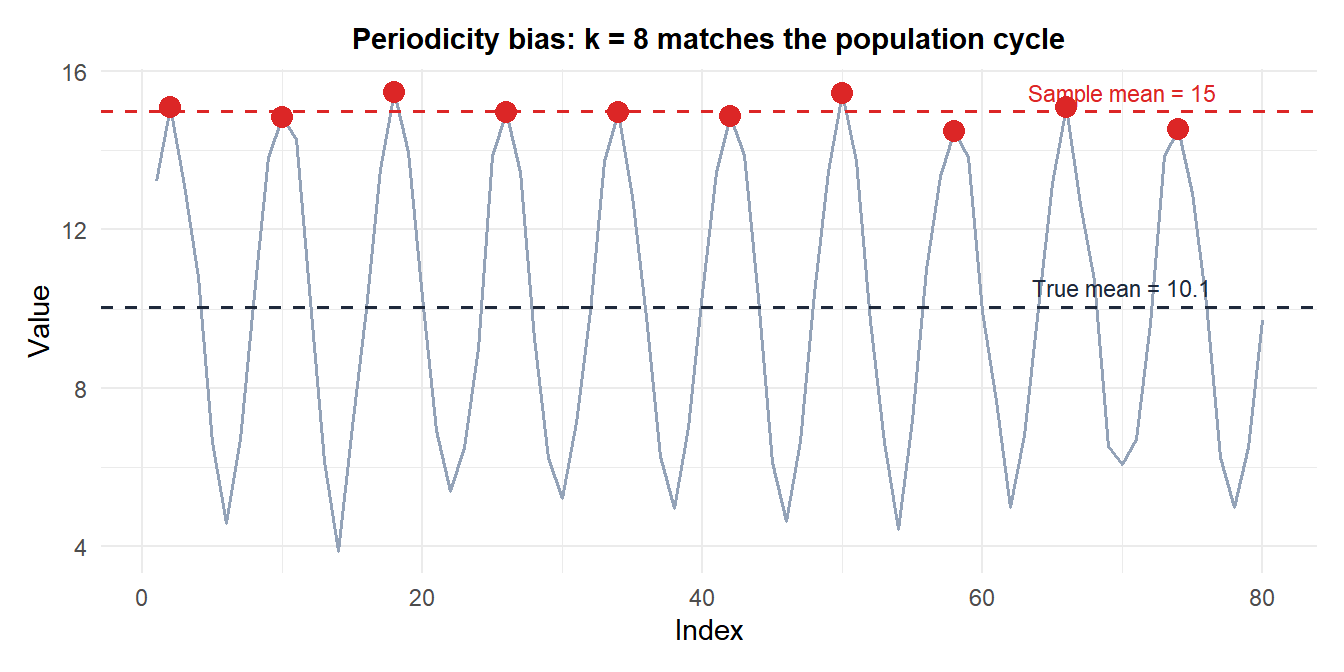
The sample (red points) consistently hits near the peaks of the cycle, producing a sample mean well above the true population mean.
Advantages and limitations
Systematic sampling is widely used because it is easy to implement and often as efficient as SRS. Its main advantages are practical: no need to generate many random numbers, simple to execute in the field, and guaranteed even spread across the list. The main limitation is the periodicity risk, which is easy to check and avoid with a quick visual inspection of the list.
💡 Circular systematic sampling for non-integer k
When \(N/n\) is not an integer, \(k = \lfloor N/n \rfloor\) may result in fewer than \(n\) units. The solution is circular systematic sampling: treat the list as circular (wrap around after the last unit), draw \(r\) from \(\{1, \ldots, N\}\) uniformly, and select units \(r, r+k, r+2k, \ldots \pmod{N}\). This guarantees exactly \(n\) units regardless of whether \(k\) divides \(N\) evenly.

