DISTRIBUTIONS
Statistical distributions describe how probability is spread across possible values of a random variable. Learn discrete and continuous distributions with formulas, properties, real-world examples and visualizations.
Discrete distributions
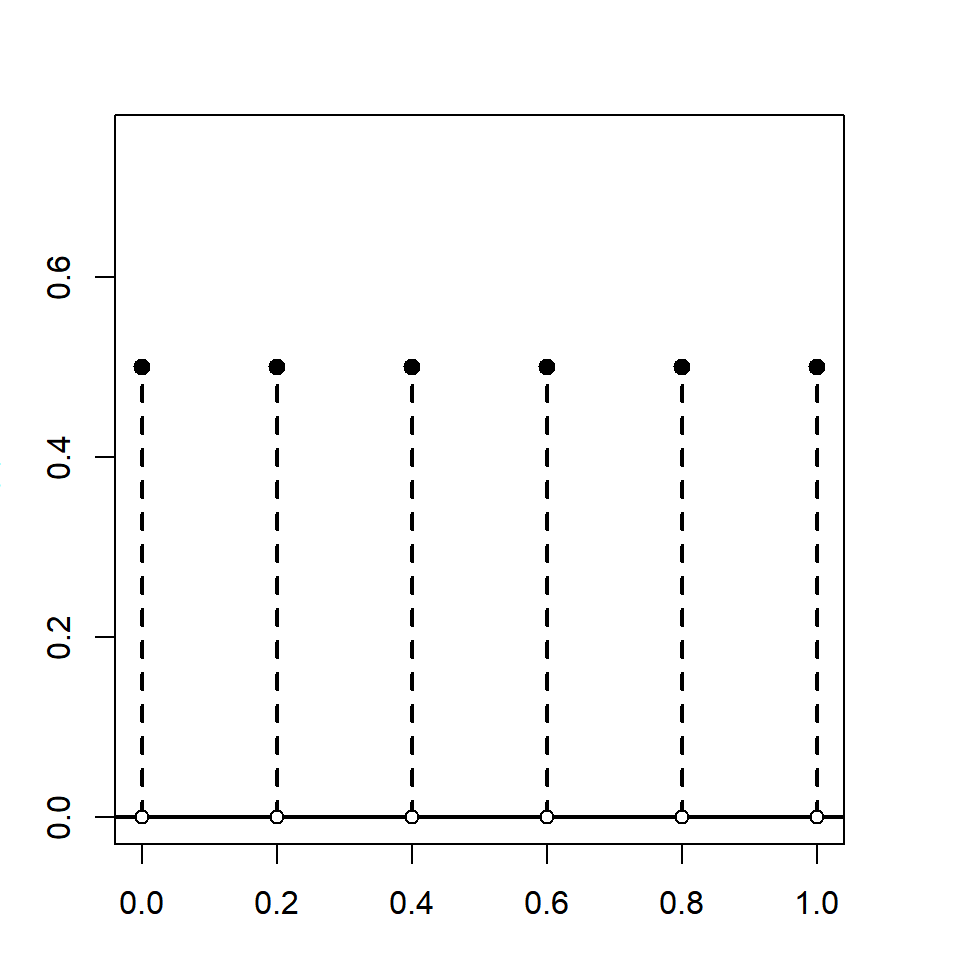
Discrete uniform distribution
This distribution assigns equal probability to a finite set of outcomes. It is used for scenarios where each outcome is equally likely, such as rolling a fair die
Discrete
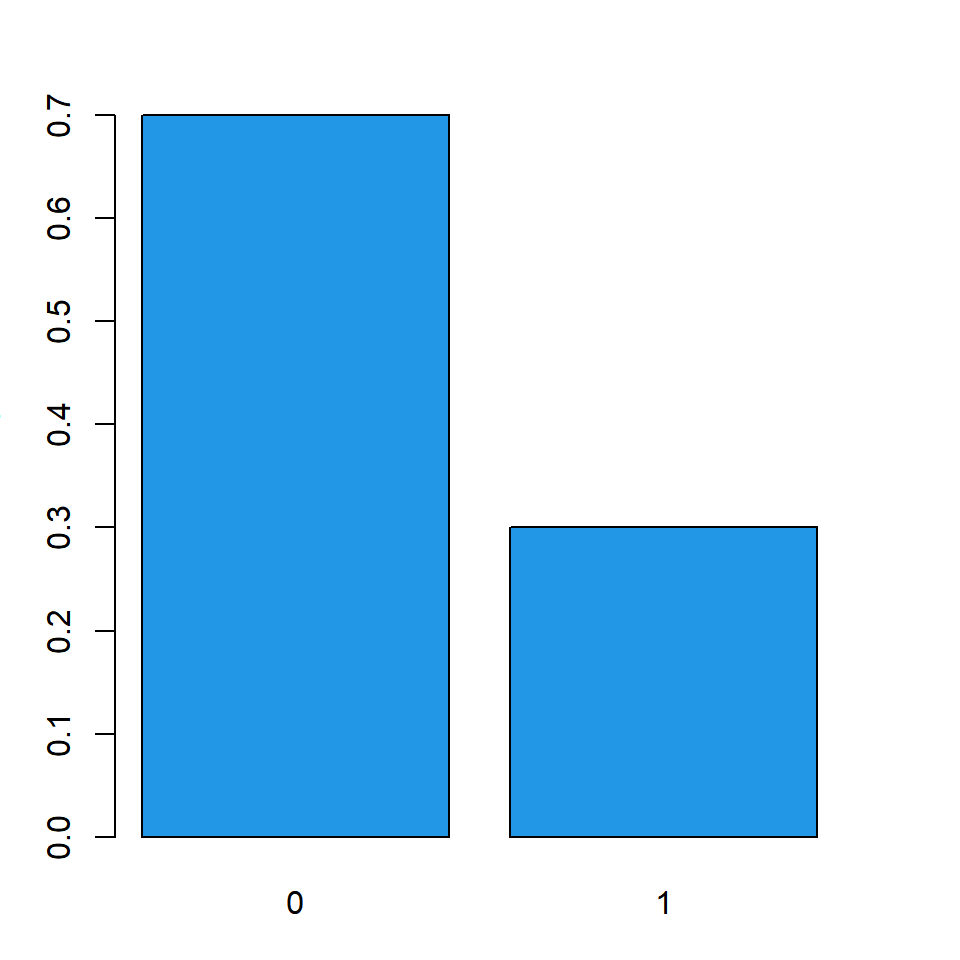
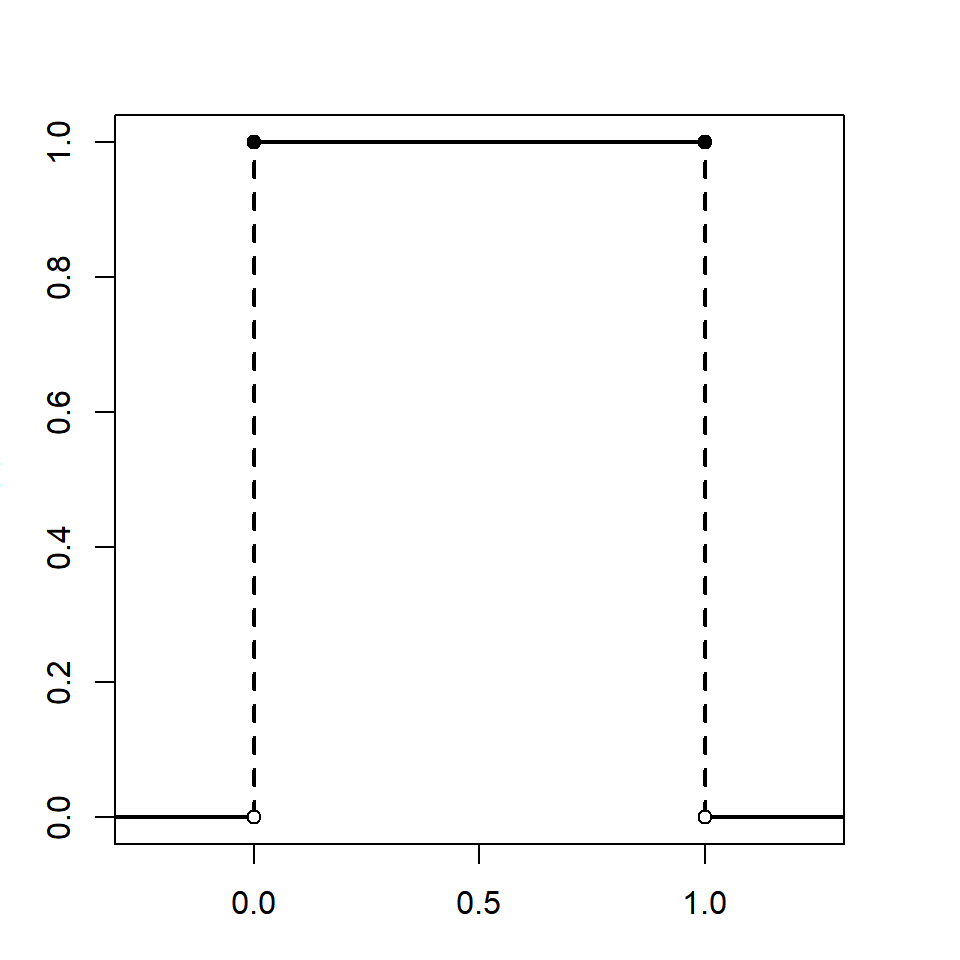
Bernoulli Distribution
This distribution represents a single trial with two possible outcomes: success (1) or failure (0). It is used to model binary outcomes, like flipping a coin.
Discrete
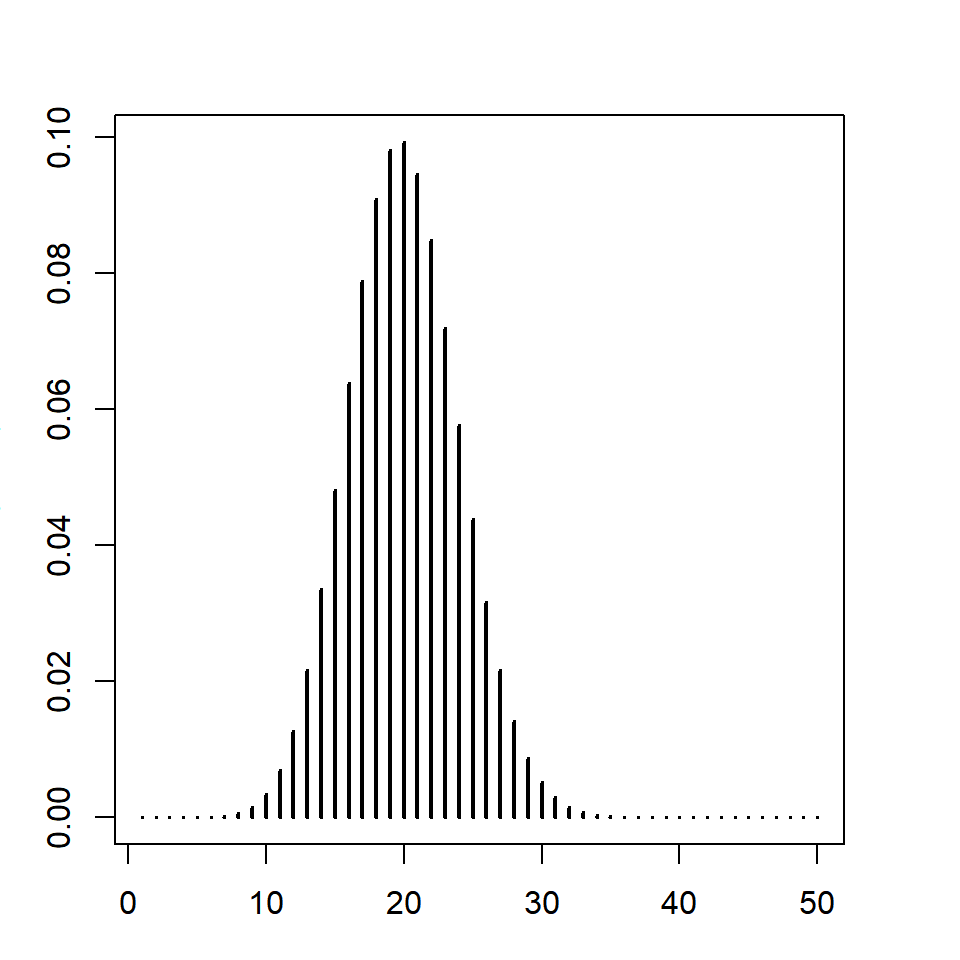
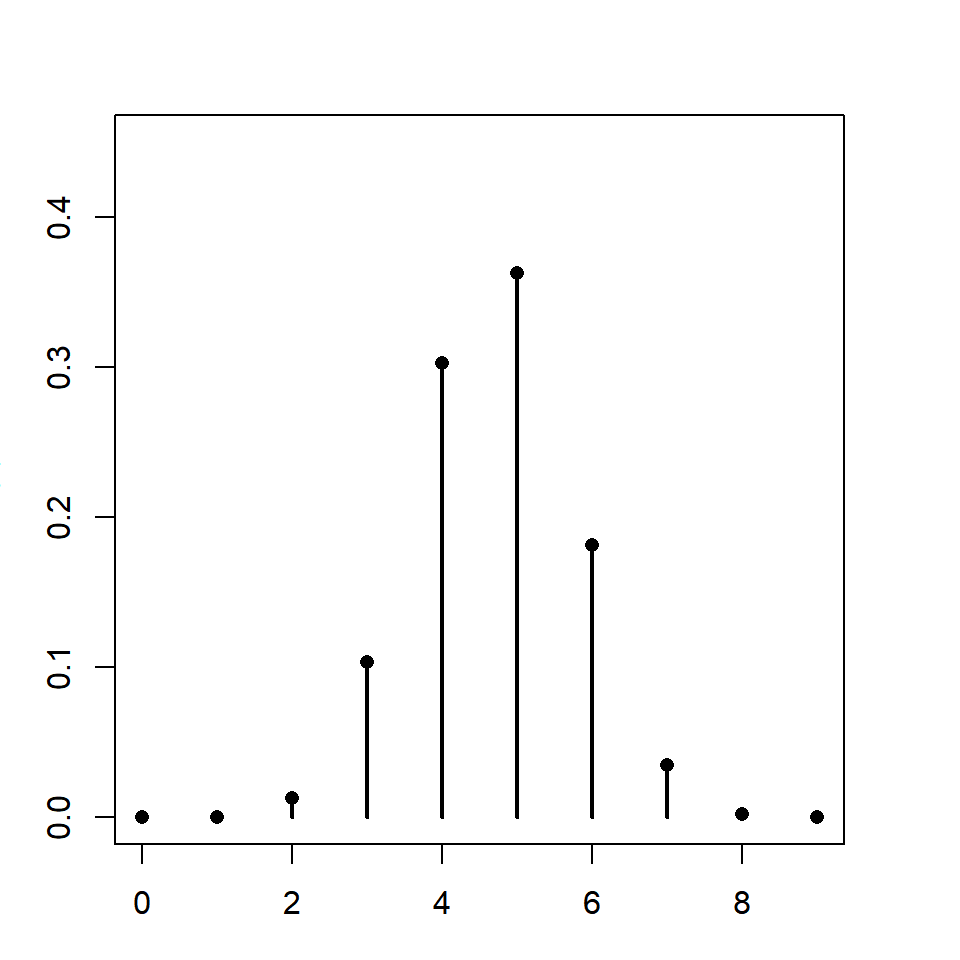
Binomial Distribution
This distribution represents the number of successes in a fixed number of independent Bernoulli trials. It is used for modeling the number of successes in a series of yes/no experiments.
Discrete
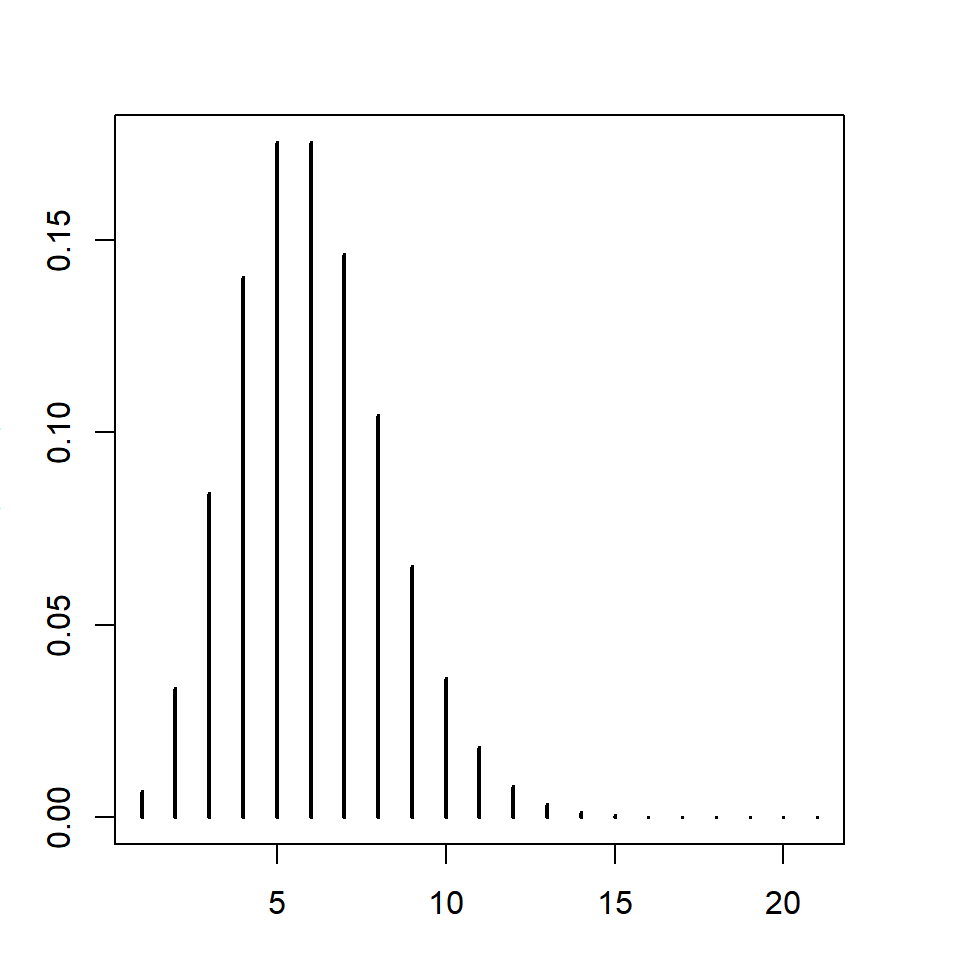
Poisson distribution
This distribution represents the number of events occurring within a fixed interval of time or space. It is used for modeling the number of events in a given time period, such as the number of phone calls received by a call center.
Discrete
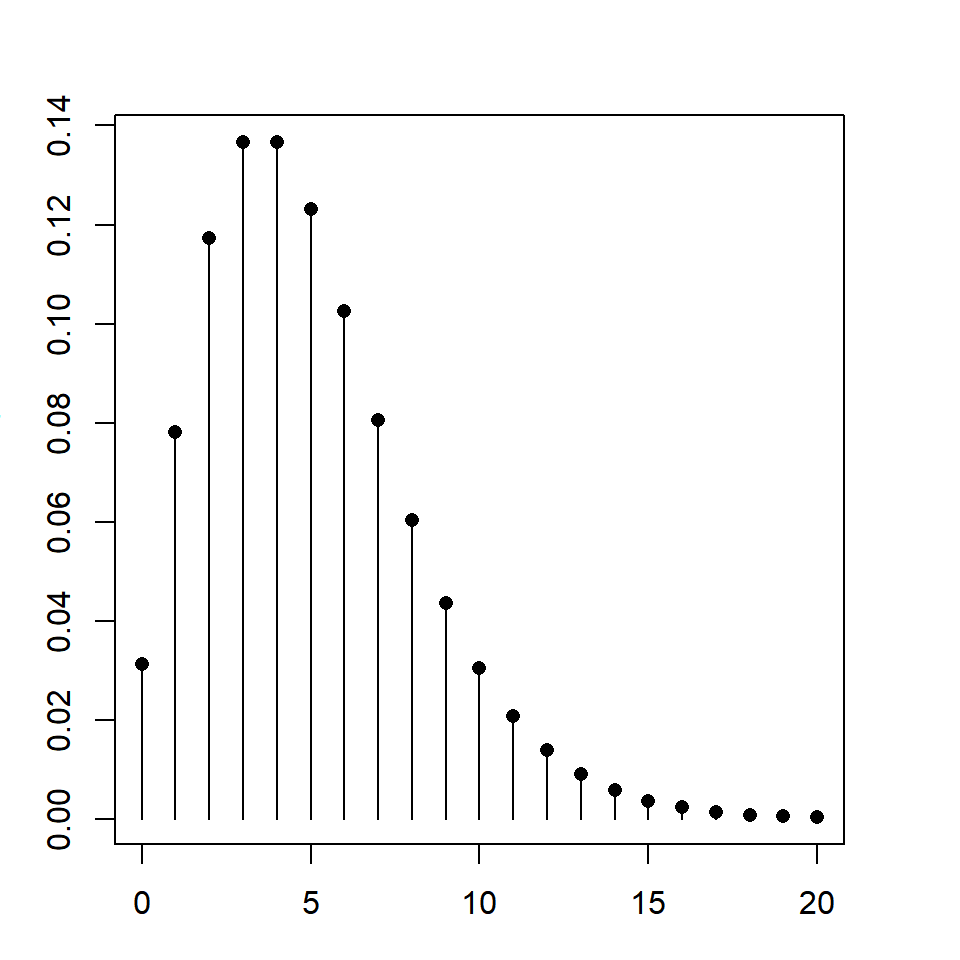
Negative binomial distribution
This distribution represents the number of failures before a specified number of successes in a series of Bernoulli trials. It is used for modeling over-dispersed count data or the number of attempts until a target number of successes is achieved
Discrete
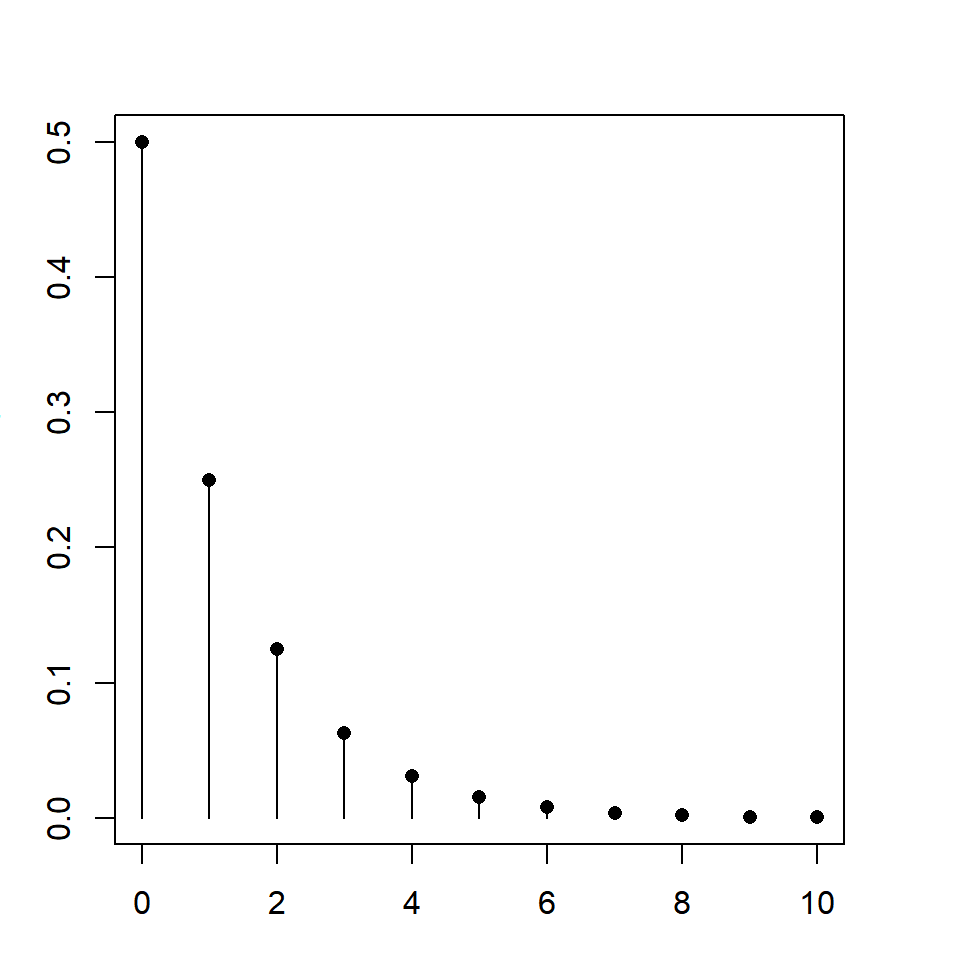
Geometric distribution
This distribution represents the number of trials needed to get the first success in a series of independent Bernoulli trials
Discrete
Hypergeometric distribution
This distribution represents the number of successes in a sample drawn without replacement from a finite population. It is used for scenarios where sampling is without replacement, like drawing cards from a deck
Discrete
Continuous distributions
Uniform distribution
This distribution assigns equal probability to all values in a continuous range. It is used for scenarios where all outcomes in a range are equally likely, such as random number generation
Continuous
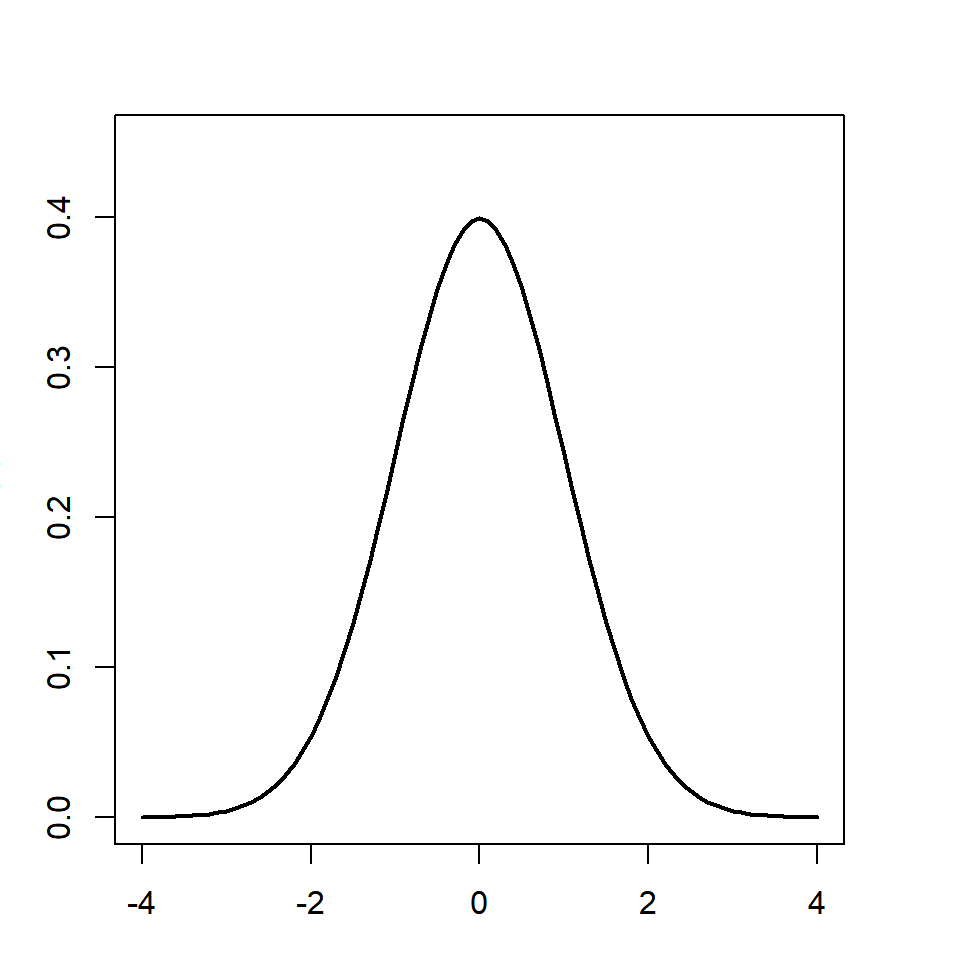
Normal distribution
This distribution is symmetric and bell-shaped, characterized by its mean and standard deviation. It is used for modeling natural phenomena and measurement errors, as it describes many real-world variables
Continuous
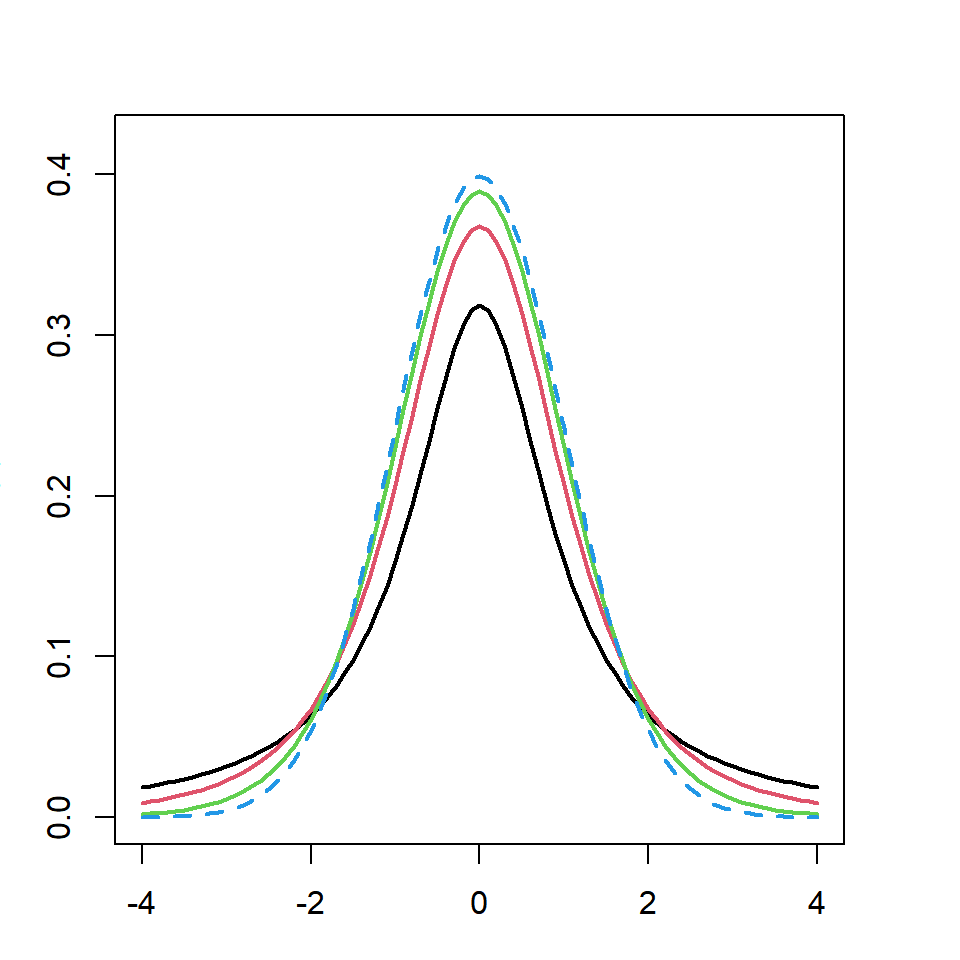
Student's t distribution
The t distribution is used for inference about means when the population variance is unknown and the sample size is small
Continuous
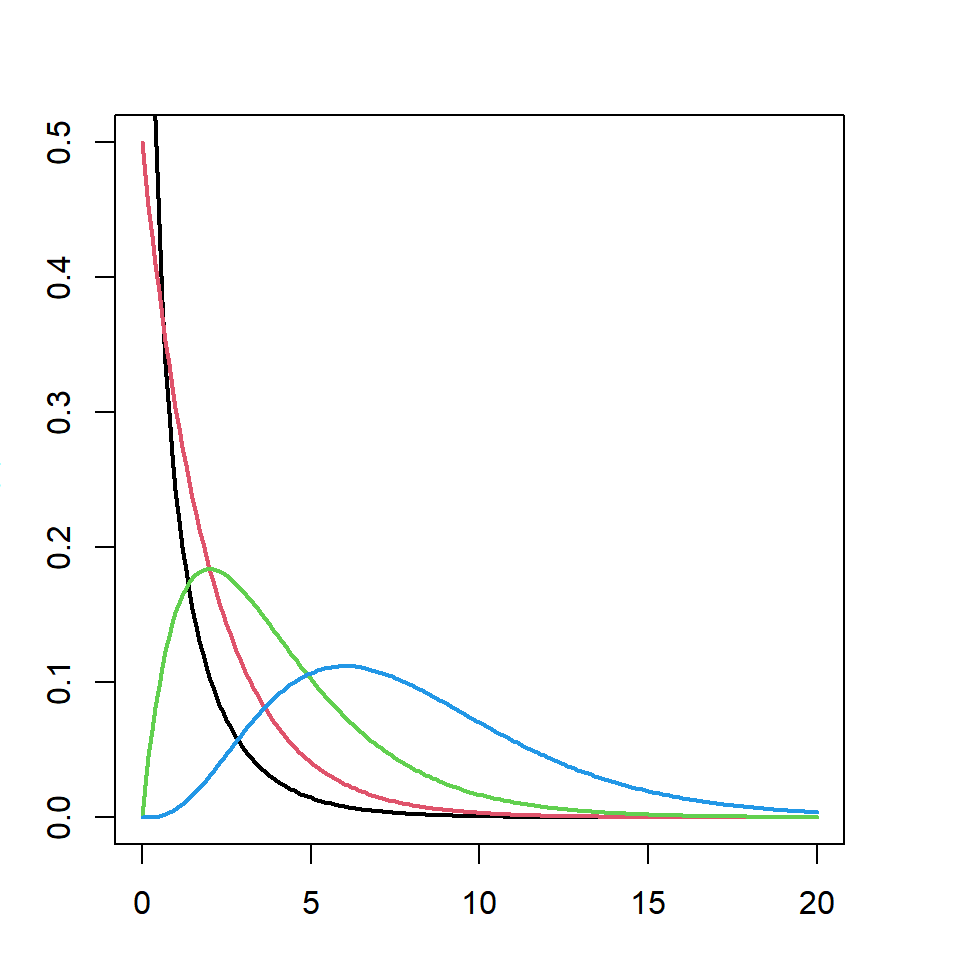
Chi-squared distribution
The chi-squared distribution is fundamental in hypothesis testing, goodness-of-fit tests, and confidence intervals for variance
Continuous
F distribution
The F distribution is used to compare variances and is fundamental in ANOVA and regression analysis
Continuous
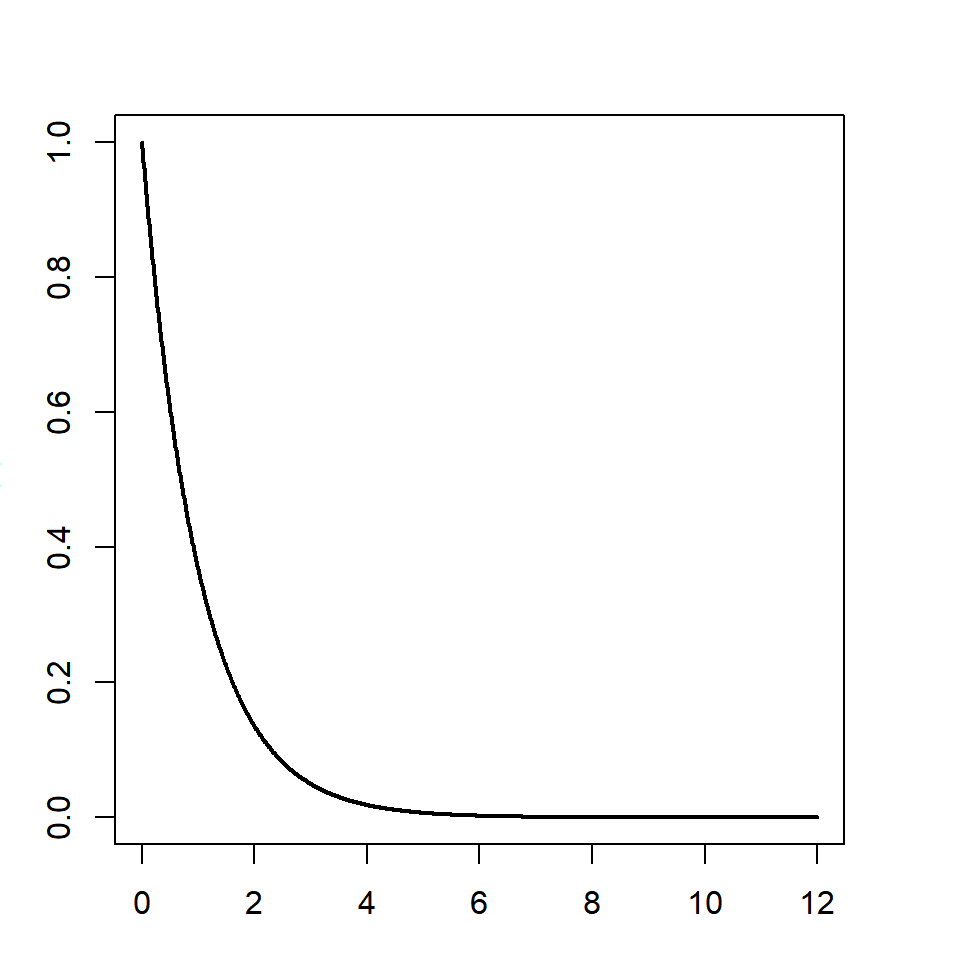
Exponential distribution
This distribution represents the time between events in a Poisson process. It is used for modeling time to failure or the time between events, such as the lifespan of an electronic component
Continuous
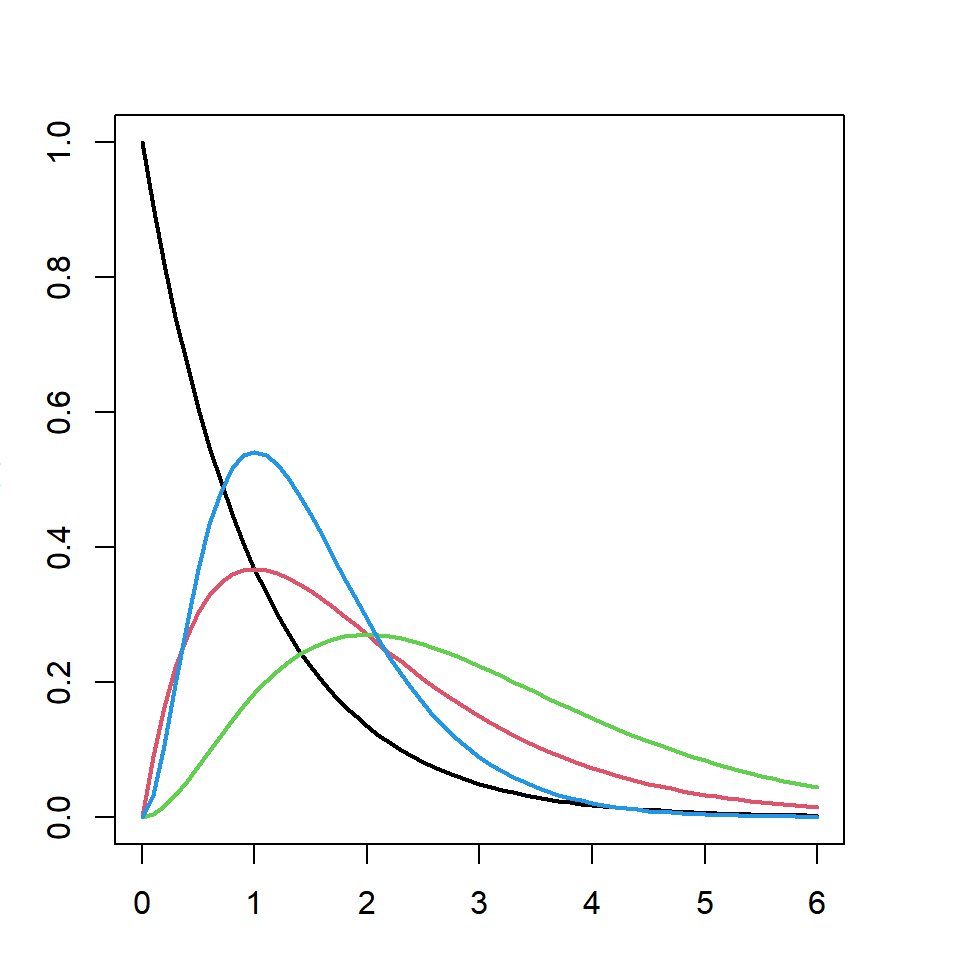
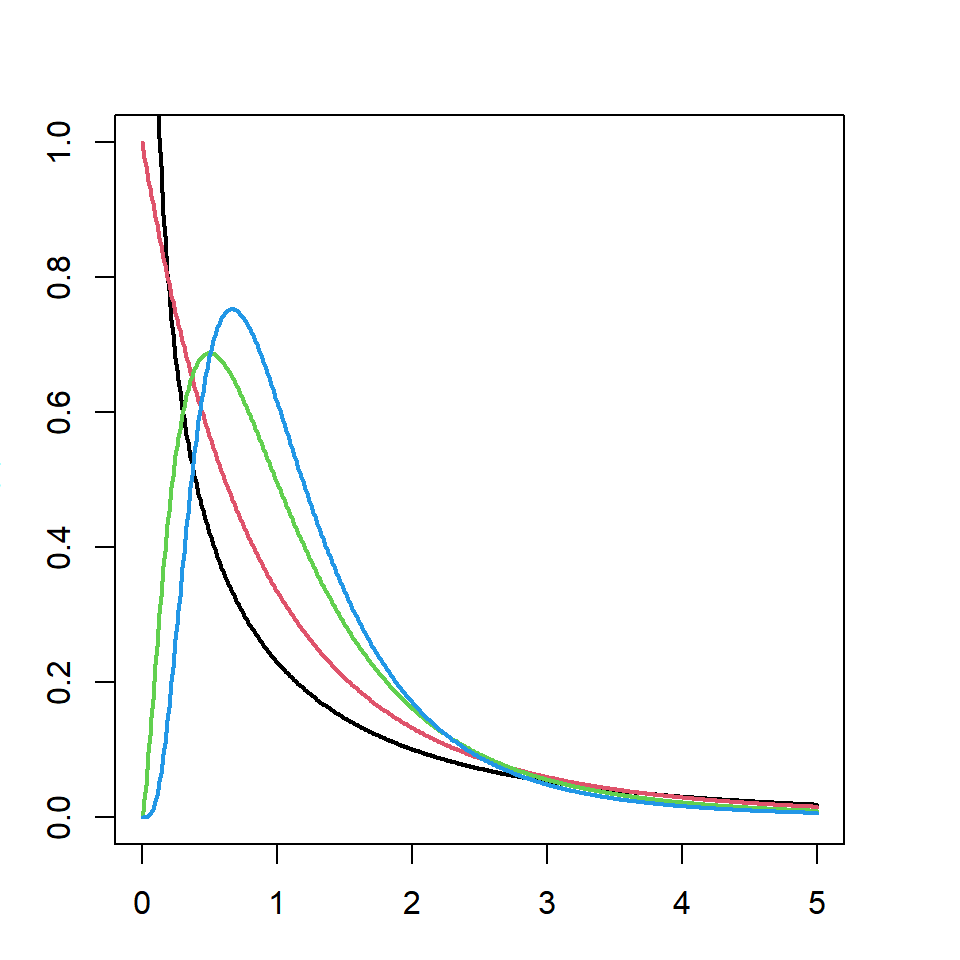
Gamma distribution
This distribution generalizes the exponential distribution with an additional shape parameter. It is used for modeling waiting times and life data analysis, such as the time until multiple events occur
Continuous
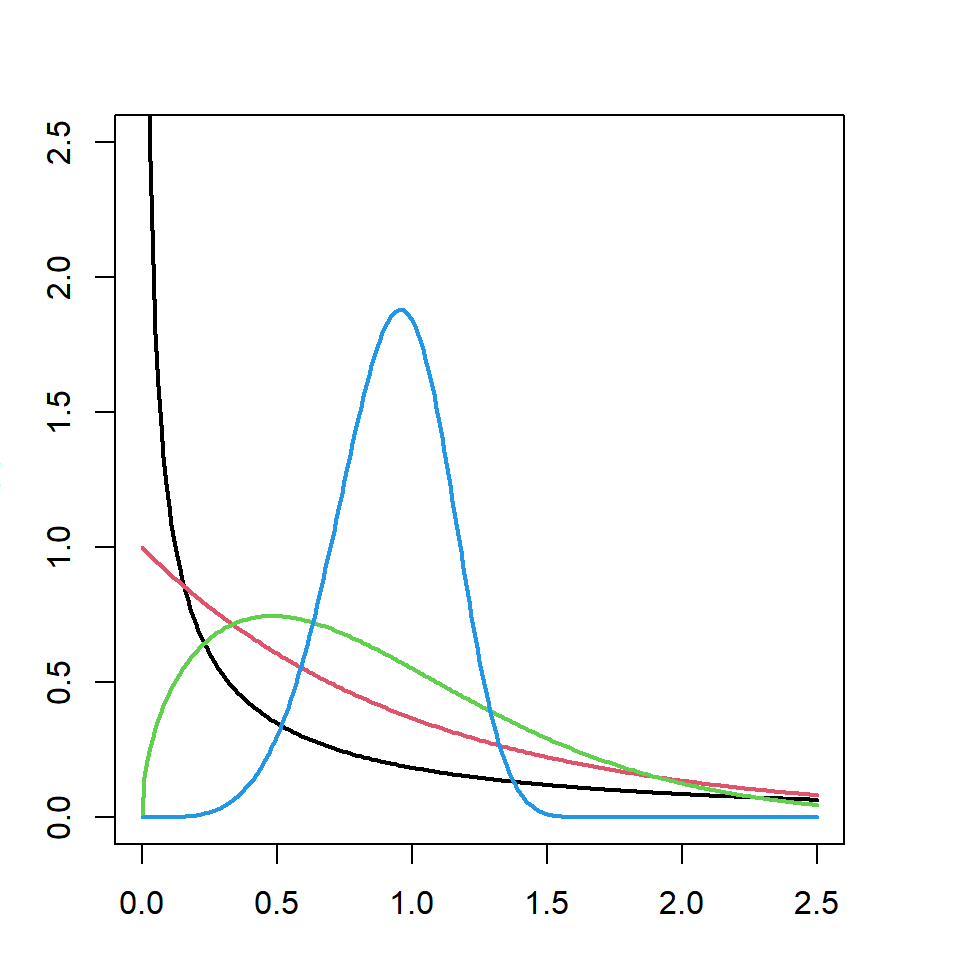
Weibull distribution
This distribution is flexible with scale and shape parameters, often used to model life data. It is used for reliability analysis and failure time analysis in engineering and survival studies
Continuous
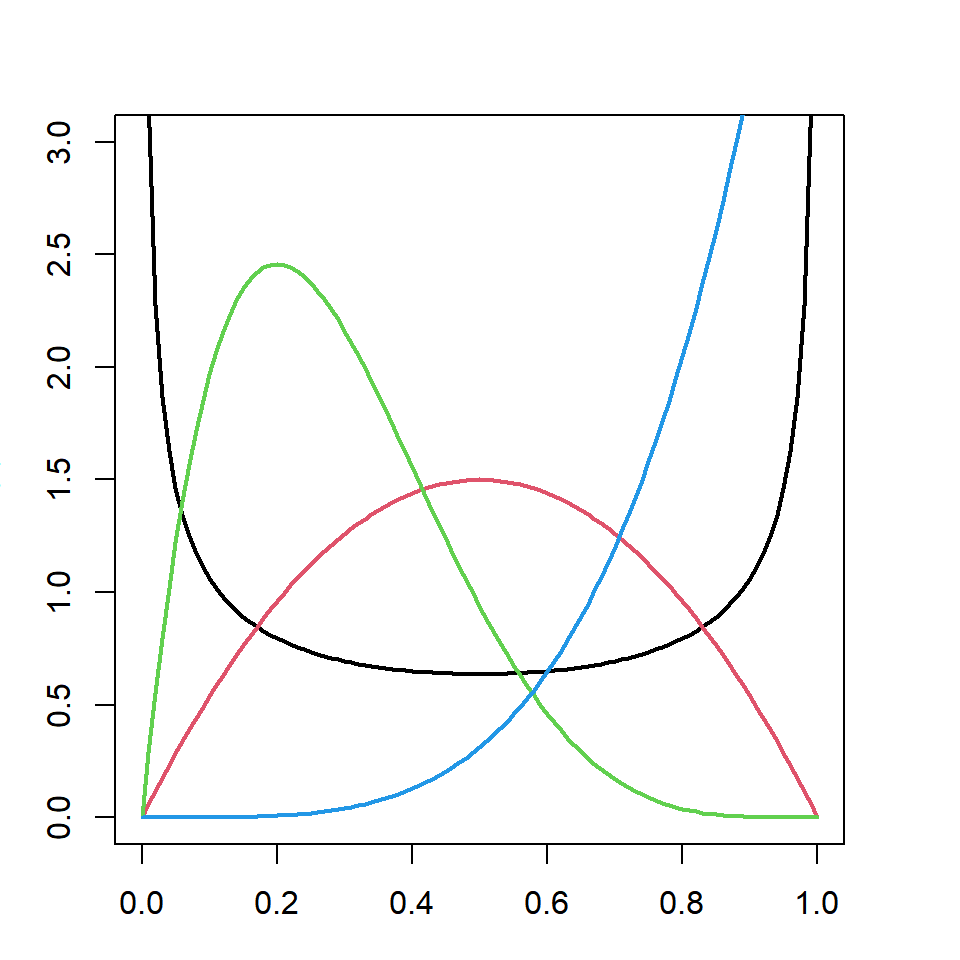
Beta distribution
The beta distribution models random variables constrained to the interval [0,1], making it ideal for probabilities, proportions, and Bayesian priors
Continuous
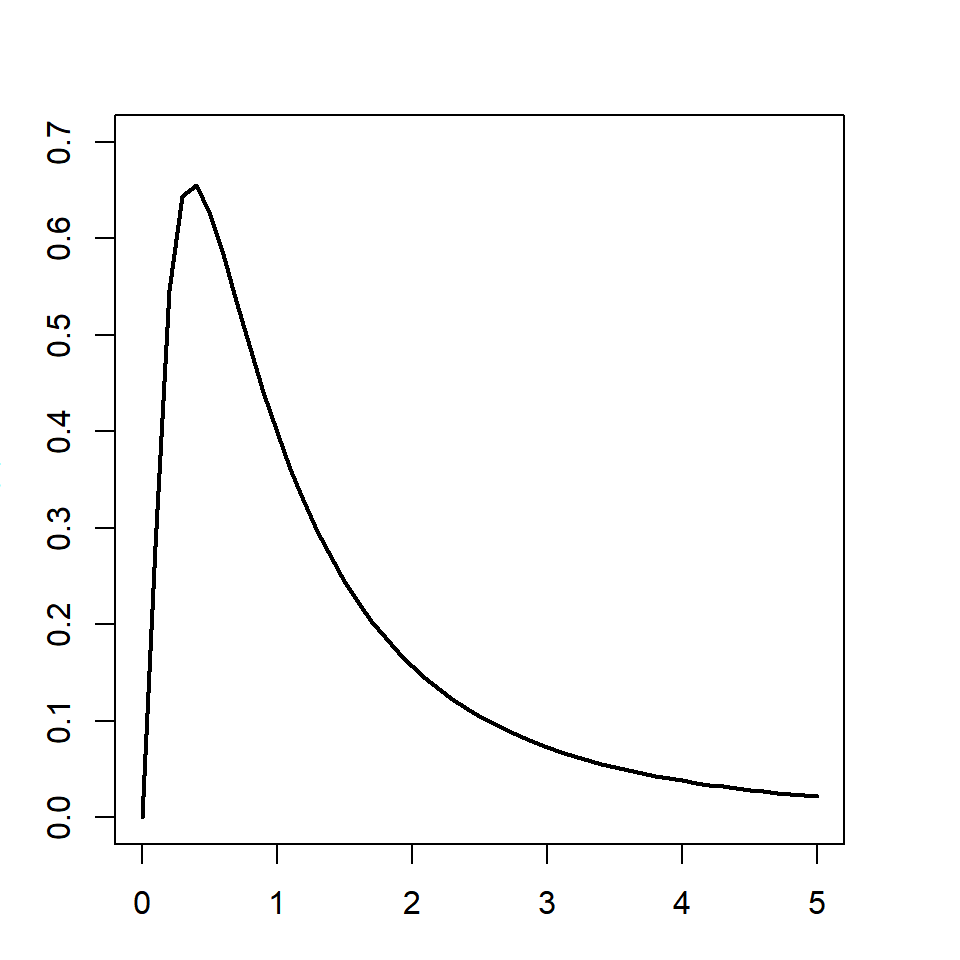
Lognormal distribution
This distribution represents a variable whose logarithm is normally distributed. It is used for modeling positively skewed data, such as incomes and stock prices
Continuous
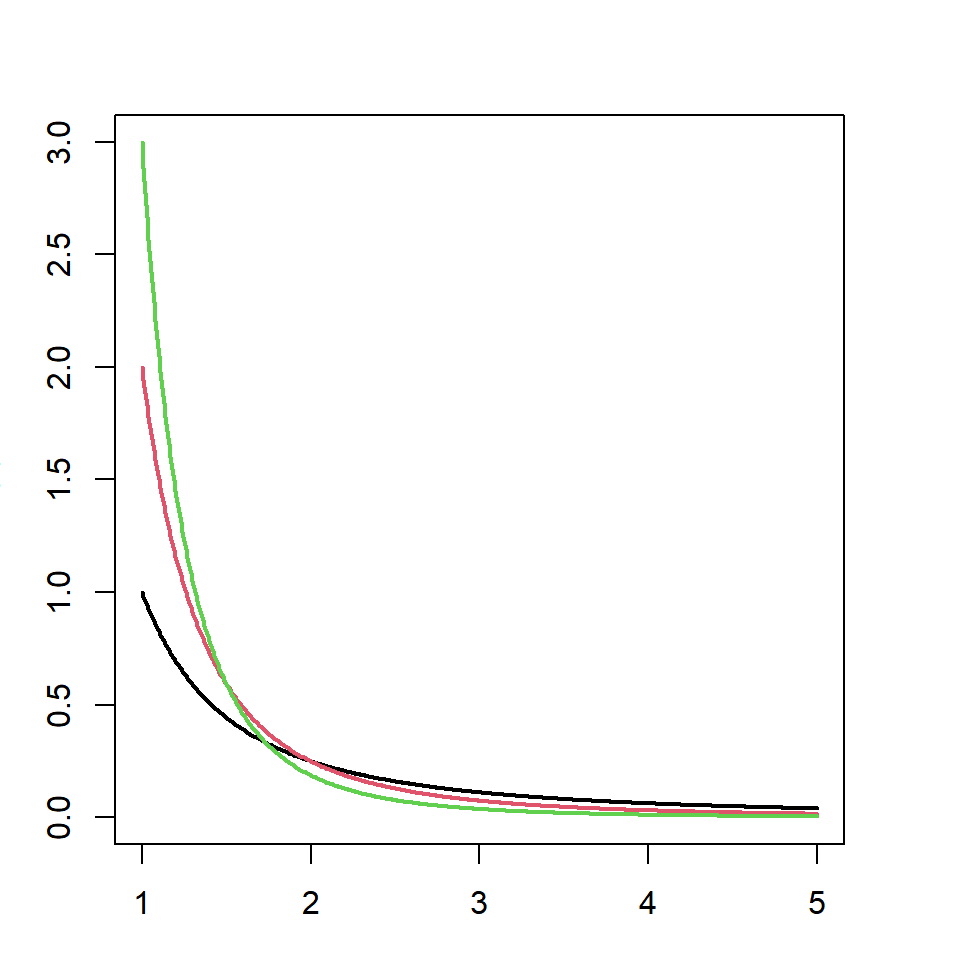
Pareto distribution
This distribution represents a power-law probability distribution used to describe phenomena with heavy tails. It is used for modeling the distribution of wealth, natural phenomena, and insurance claims.
Continuous