Polyetapic sampling
Polyetapic sampling, also called multistage sampling, applies cluster sampling sequentially across two or more levels of a population hierarchy. It is the standard design for national surveys: countries are too large to list individuals directly, but lists of regions, municipalities, and households can be combined into a workable sampling procedure.
Polyetapic vs single-stage cluster sampling
Single-stage cluster sampling selects clusters and measures all (or a random sample of) units within them in one step. Multistage sampling adds further stages of selection within the selected clusters:
- Stage 1: select primary sampling units (PSUs), e.g., provinces or districts.
- Stage 2: within each selected PSU, select secondary sampling units (SSUs), e.g., municipalities or census blocks.
- Stage 3: within each selected SSU, select tertiary units, e.g., households.
- Final stage: within selected households, select or interview one individual.
Each stage introduces its own sampling fraction and, potentially, its own sampling method (SRS, systematic, PPS).
Selection probabilities across stages
A key property of multistage designs: the overall selection probability of any unit is the product of the selection probabilities at each stage.
For a three-stage design:
\[\pi_i = \pi_{i}^{(1)} \times \pi_{i}^{(2)} \times \pi_{i}^{(3)}\]
where \(\pi_i^{(s)}\) is the probability of unit \(i\) being selected at stage \(s\). If \(\pi_i\) is the same for all units in the population, the design is self-weighting and the unweighted sample mean is an unbiased estimator of the population mean.
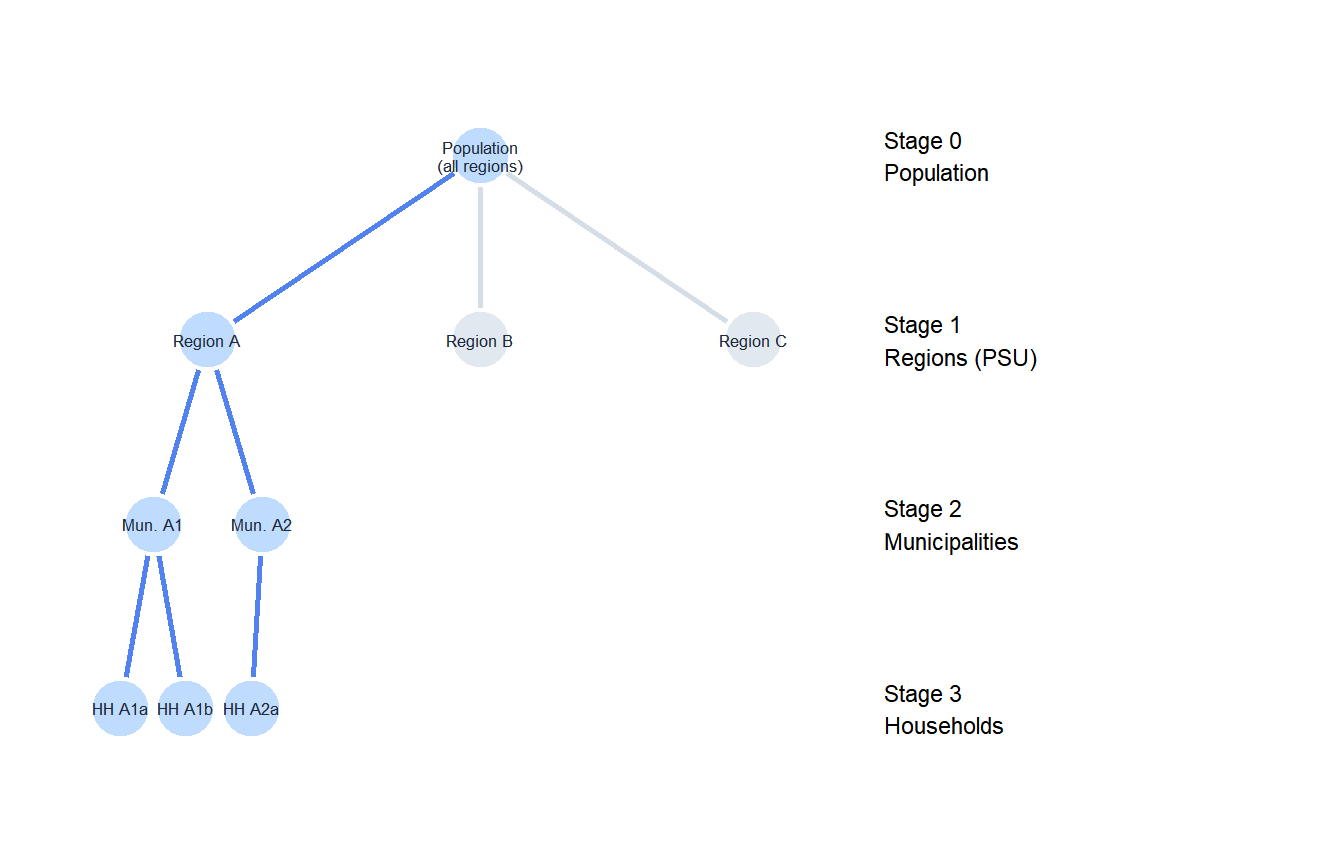
Blue nodes and edges show the selected path. Only Region A is selected at stage 1; within it, municipalities A1 and A2; within each, specific households.
Probability proportional to size (PPS) sampling
In national surveys, PSUs (regions, municipalities) vary enormously in size. Selecting them with equal probability would give a small village the same chance as a large city, resulting in a very inefficient design. The standard solution is probability proportional to size (PPS) at the first stage:
\[\pi_i^{(1)} = m \cdot \frac{M_i}{\sum_j M_j}\]
where \(m\) is the number of PSUs to select and \(M_i\) is the size (number of households, population) of PSU \(i\). Larger PSUs are more likely to be selected.
The key advantage: if the second stage then selects a fixed number of units \(n_0\) from each selected PSU, the overall selection probability becomes:
\[\pi_i = m \cdot \frac{M_i}{\sum M_j} \times \frac{n_0}{M_i} = \frac{m \cdot n_0}{\sum M_j}\]
The \(M_i\) terms cancel, giving equal probability of selection for all individuals: a self-weighting design. This simplifies estimation enormously.
A country has \(\sum M_j = 10{,}000\) census blocks. The survey selects:
- Stage 1: \(m = 100\) blocks using PPS.
- Stage 2: \(n_0 = 10\) households per selected block using SRS.
- Stage 3: 1 adult per household.
Total sample: \(100 \times 10 \times 1 = 1{,}000\) adults.
Selection probability of any adult in the country:
\[\pi = \frac{100 \times 10}{10{,}000} = \frac{1{,}000}{10{,}000} = 0.10 = 10\%\]
Every adult has the same 10% chance of selection, regardless of which block they live in. The design is self-weighting.
For a block with \(M_i = 80\) households: - Stage 1 probability: \(100 \times 80/10{,}000 = 0.80\) - Stage 2 probability: \(10/80 = 0.125\) - Overall: \(0.80 \times 0.125 = 0.10\) ✓
Design effect in polyetapic sampling
Each stage introduces clustering, so the design effect accumulates. For a two-stage design with \(m\) PSUs and \(n_0\) units per PSU:
\[\text{DEFF} \approx 1 + (n_0 - 1)\rho\]
where \(\rho\) is the ICC within PSUs. The same formula as single-stage cluster sampling, but now applies to the PSU level. Additional stages add further design effects.
To achieve an effective sample size of \(n_\text{eff}\), the actual sample must be:
\[n = n_\text{eff} \times \text{DEFF}\]
⚠️ Always account for the complex design when analyzing multistage data
Standard formulas for standard errors, confidence intervals, and p-values assume SRS. Polyetapic samples violate this assumption at every stage. Ignoring the design:
- Underestimates standard errors (sometimes by a factor of 2 or more).
- Produces confidence intervals that are too narrow.
- Inflates test statistics and p-values.
In R, use the survey package, which correctly handles stratification, clustering, and unequal selection probabilities:
library(survey)
design <- svydesign(ids = ~psu + household,
                    weights = ~weight,
                    data = survey_data)
svymean(~outcome, design)
Major international surveys (DHS, PISA, Eurobarometer, NHANES) provide design variables precisely so that analysts can account for the complex sampling.
When polyetapic sampling is the right design
Polyetapic sampling is the standard design for:
- National household surveys: no individual registry exists; administrative hierarchies (regions → municipalities → census blocks → households) provide natural stages.
- Educational assessments: countries → schools → classrooms → students.
- Epidemiological surveys: districts → health facilities → patient records.
It is almost always combined with stratification at the first stage (divide the country into strata, then select PSUs within each stratum using PPS) to improve efficiency and ensure geographic coverage.
Comparing the five sampling methods
| Method | Frame needed | Efficiency vs SRS | Best for |
|---|---|---|---|
| SRS | Complete individual list | Baseline | Small, homogeneous populations |
| Systematic | Ordered list | \(\geq\) SRS | Ordered lists without periodicity |
| Stratified | List + stratum membership | \(>\) SRS | Heterogeneous populations with known subgroups |
| Cluster | List of clusters only | \(<\) SRS | Dispersed populations, cost constraints |
| Polyetapic (multistage) | Lists at each level | \(<\) SRS | National surveys, no complete individual frame |

