t-SNE and UMAP
t-SNE and UMAP are nonlinear dimensionality reduction methods designed for visualization. Unlike PCA, which finds a linear projection that maximizes variance, they preserve the local neighborhood structure of the data: points that are close in high-dimensional space remain close in 2D. The result is a map that reveals clusters, manifold structure, and subpopulations invisible in a PCA plot.
Why PCA is not enough for visualization
PCA is a linear projection: it finds the best flat 2D plane through the high-dimensional data. If the data lies on a curved manifold (e.g., a Swiss roll, a sphere, or a collection of clusters connected by thin bridges), the linear projection crushes the structure and overlaps distant regions.
t-SNE and UMAP learn a nonlinear mapping that “unfolds” the manifold, separating regions that are genuinely different in high dimensions even if they project to the same region under PCA.
t-SNE: t-distributed Stochastic Neighbor Embedding
t-SNE (van der Maaten and Hinton, 2008) converts distances into probabilities separately in the high-dimensional and low-dimensional spaces, then minimizes the KL divergence between them.
In the high-dimensional space: define a Gaussian similarity between points \(i\) and \(j\):
\[p_{j|i} = \frac{\exp(-\|x_i - x_j\|^2 / 2\sigma_i^2)}{\sum_{k \neq i} \exp(-\|x_i - x_k\|^2 / 2\sigma_i^2)}, \quad p_{ij} = \frac{p_{j|i} + p_{i|j}}{2n}\]
The bandwidth \(\sigma_i\) is set so that the effective number of neighbors (perplexity) is approximately the user-specified perplexity parameter.
In the low-dimensional space: use a Student-t distribution with 1 degree of freedom (heavier tails than Gaussian):
\[q_{ij} = \frac{(1 + \|y_i - y_j\|^2)^{-1}}{\sum_{k \neq l}(1 + \|y_k - y_l\|^2)^{-1}}\]
Objective: minimize the KL divergence \(\text{KL}(P \| Q) = \sum_{ij} p_{ij} \log(p_{ij}/q_{ij})\) via gradient descent.
Why the t-distribution? A Gaussian in low dimensions is too concentrated: moderately distant points in high dimensions would all need to be packed close together in 2D (the crowding problem). The heavy tails of the t-distribution allow moderately similar points to be placed farther apart, giving clusters room to breathe.
UMAP: Uniform Manifold Approximation and Projection
UMAP (McInnes et al., 2018) is built on a different mathematical foundation (fuzzy simplicial sets and Riemannian geometry) but shares the same high-level idea: preserve neighborhood structure. Key differences from t-SNE:
- Faster: \(O(n \log n)\) vs t-SNE’s \(O(n^2)\) (Barnes-Hut approximation).
- Better global structure: UMAP attempts to preserve both local and global relationships, not just local ones.
- More stable: less sensitive to random initialization; multiple runs give more similar results.
- General purpose: can project to arbitrary dimensions, not just 2D.
UMAP constructs a fuzzy topological representation of the data, finds a low-dimensional representation with a similar topological structure, and optimizes the cross-entropy between the two fuzzy sets.
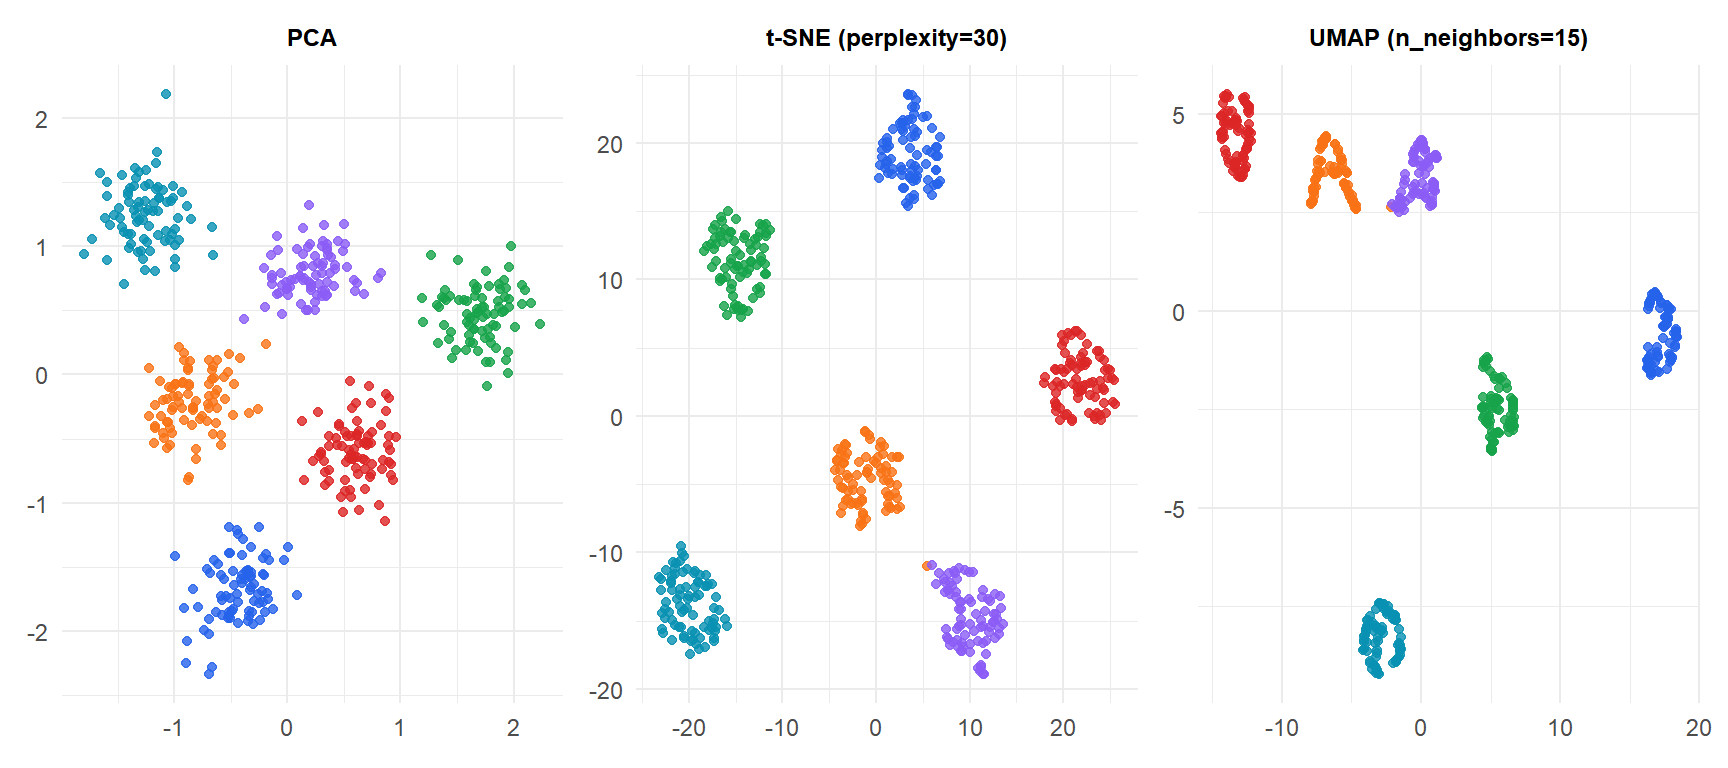
All three methods correctly separate the six clusters on this simple 2D dataset. The advantage of t-SNE and UMAP becomes clear with high-dimensional data (e.g., images, genomics, single-cell RNA-seq) where PCA overlaps distinct subpopulations.
Key hyperparameters
t-SNE: perplexity
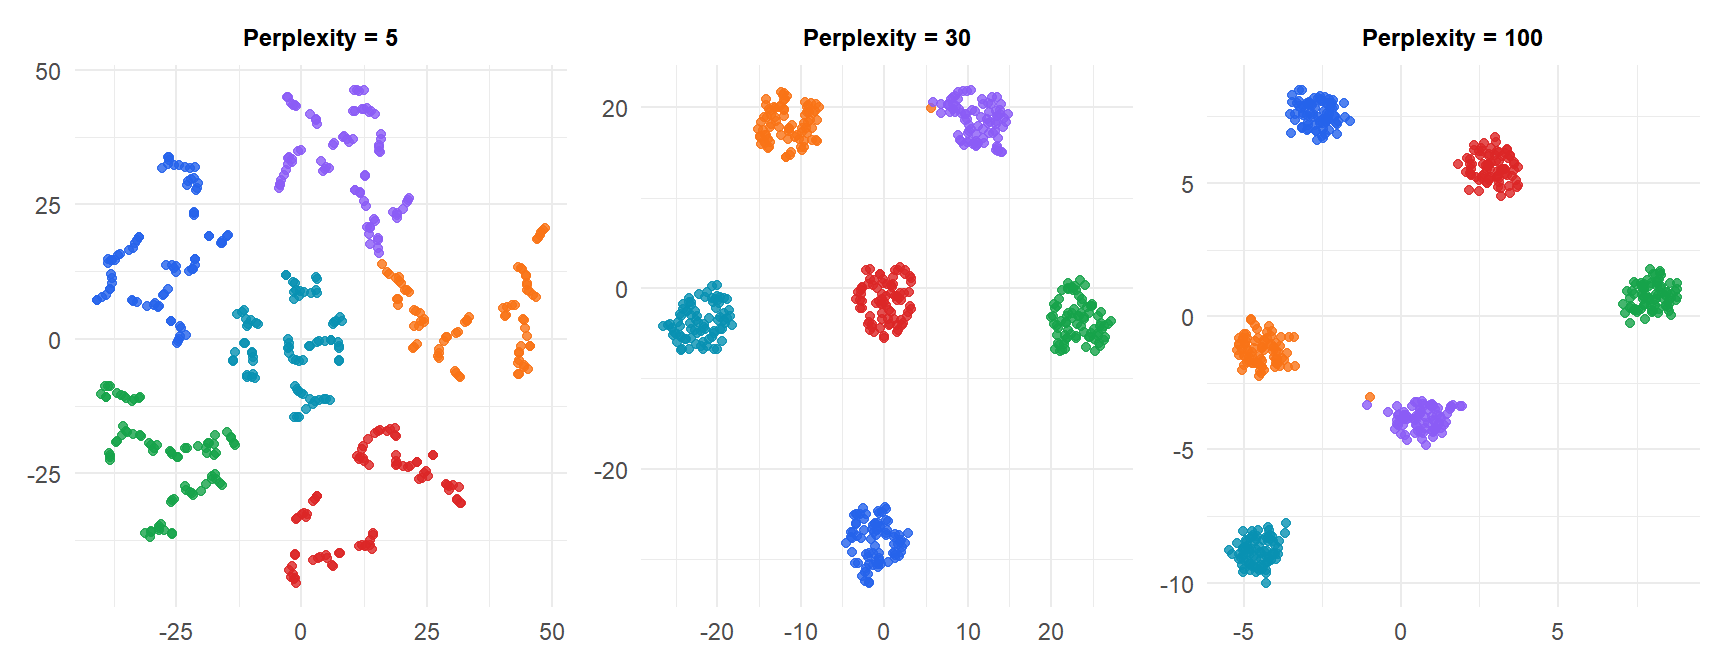
Perplexity controls the effective number of neighbors each point considers. It roughly balances attention between local and global structure:
- Low perplexity (5-10): very local, tight clusters, may fragment large clusters into subclusters.
- High perplexity (50-100): more global, clusters may merge.
- Typical range: 5 to 50. Default: 30.
Rule of thumb: perplexity should be less than \(n/3\).
UMAP: n_neighbors and min_dist
n_neighbors controls the size of the local neighborhood (like perplexity): larger values capture more global structure. min_dist controls how tightly points are packed in the embedding: small values produce tight clusters; large values spread points out more.
Critical pitfalls in interpretation
⚠️ Four things t-SNE and UMAP plots do NOT tell you
1. Cluster sizes are meaningless. t-SNE expands small dense clusters and compresses large sparse ones. The visual size of a cluster does not reflect the number of points or the spread of the original data.
2. Distances between clusters are not interpretable. t-SNE optimizes local structure; the distance between two well-separated clusters in the 2D plot has no quantitative meaning. Cluster A being twice as far from cluster B as from cluster C does not mean it is twice as different.
3. The number of clusters is not reliable. Both methods can split a single continuous population into apparent subclusters (especially t-SNE with low perplexity) or merge distinct clusters (with high perplexity). Always validate apparent clusters with a clustering algorithm on the original high-dimensional data.
4. Results change with random seed. t-SNE is non-deterministic; each run with a different seed produces a different layout. UMAP is more stable but still varies. Never base conclusions on a single run. For t-SNE, initialize with PCA (pca_init=TRUE) and use multiple seeds.
t-SNE vs UMAP: when to use each
| t-SNE | UMAP | |
|---|---|---|
| Speed | Slow (\(O(n^2)\), Barnes-Hut \(O(n \log n)\)) | Fast (\(O(n \log n)\)) |
| Global structure | Poor | Better |
| Stability | Low (varies by seed) | Higher |
| Scalability | \(n < 100{,}000\) | \(n > 100{,}000\) feasible |
| Interpretability | Very limited | Slightly better |
| Typical use | Biology, single-cell RNA-seq | General purpose, large datasets |
For most new projects: start with UMAP. It is faster, more stable, and preserves more structure. Use t-SNE when comparing with published work that uses it, or in genomics where it is the field standard.
💡 t-SNE and UMAP in R
library(Rtsne)

# t-SNE (remove duplicates first, PCA init for stability)
set.seed(42)
tsne_res <- Rtsne(X, dims=2, perplexity=30, max_iter=1000,
                  pca=TRUE, pca_center=TRUE, normalize=TRUE,
                  check_duplicates=FALSE)
df_tsne <- data.frame(D1=tsne_res$Y[,1], D2=tsne_res$Y[,2])

# UMAP
library(umap)
set.seed(42)
umap_res <- umap(X, n_neighbors=15, min_dist=0.1, n_components=2)
df_umap  <- data.frame(D1=umap_res$layout[,1], D2=umap_res$layout[,2])

# uwot package (faster UMAP, more control)
library(uwot)
embedding <- uwot::umap(X, n_neighbors=15, min_dist=0.1,
                         metric="euclidean", n_epochs=200)
