What is Statistics? Objectives, steps, applications and tools
Statistics is the science behind collecting, describing, and drawing conclusions from data. Whenever you see a poll result, a clinical trial outcome, or a sports performance ranking, someone has applied statistics to produce it.
What is Statistics?
Statistics is a branch of mathematics focused on collecting, organizing, analyzing, and interpreting data. But that definition undersells it. Statistics is really about making decisions under uncertainty, and that makes it one of the most practical disciplines you can study.
You can rarely study an entire population. You cannot measure the blood pressure of every adult on the planet, or ask every voter in a country who they support. Statistics gives you the tools to work with a manageable sample and still reach valid conclusions about the whole.
There are two broad areas you will encounter throughout this site:
- Descriptive statistics: summarizing and describing the data you have, using means, charts, and tables.
- Inferential statistics: using that data to draw conclusions about a larger population, through hypothesis tests, confidence intervals, and regression models.
Both are essential, and most real analyses use both.
Steps of a statistical study
A statistical analysis is not just “run a test and report a number.” It follows a structured process, closer to the scientific method than to a single calculation. Here are the typical steps:
Define the problem: what question are you actually trying to answer? A vague question leads to a meaningless analysis.
Design the data collection: surveys, experiments, observational studies. The design matters enormously for the validity of your conclusions.
Collect the data: gather the raw information according to your design.
Clean and prepare the data: deal with missing values, outliers, and errors. In practice, this step takes longer than most students expect.
Exploratory data analysis (EDA): visualize and summarize the data before applying any formal model. This is where you spot patterns, anomalies, and potential issues.
Model and analyze: apply the appropriate statistical methods, such as tests, models, and estimations. Always check that the method’s assumptions are met.
Interpret and communicate: translate the numbers into conclusions. A result that cannot be explained clearly is not a finished result.
Make decisions: the whole point. Statistics informs decisions; it does not make them automatically.
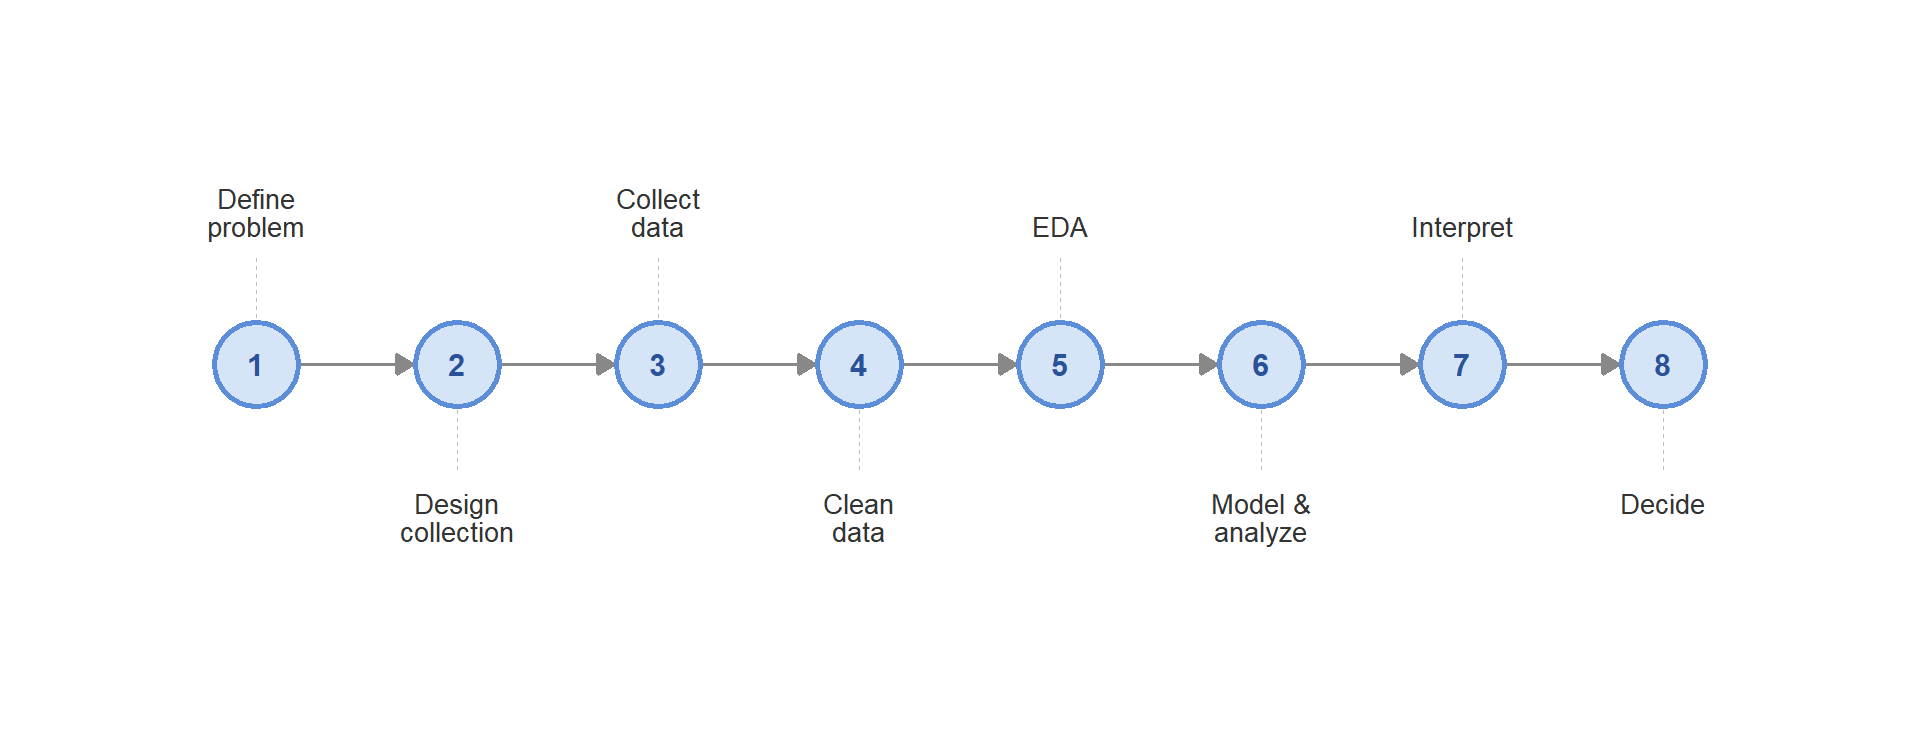
Figure 1: The statistical process: from question to decision
⚠️ Common pitfall
Many students skip step 6’s validation: they apply a t-test without checking normality, or run a regression without inspecting the residuals. The test will still produce a number. That number just might be wrong.
Where statistics is actually used
Statistics appears in almost every field that works with data. A few concrete examples:
Medicine and public health: determining whether a new drug works better than a placebo, tracking disease outbreaks, or estimating how many people in a population have a condition without testing everyone.
Economics and finance: forecasting GDP growth, modeling inflation, assessing the risk of an investment portfolio.
Engineering and quality control: monitoring production lines to detect defects before they become a problem. Six Sigma, the quality methodology used by manufacturers worldwide, is essentially applied statistics.
Social sciences and politics: election polling, measuring inequality with the Gini coefficient, studying the effect of public policies.
Sports analytics: from batting averages in baseball to expected goals (xG) in football. Modern sports are deeply statistical.
Environmental science: modeling climate change, estimating species populations, tracking pollution levels over time.
When a news article says “60% of people support this policy (margin of error ±3%, n=1,000)”, every number in that sentence comes from statistics: the sampling method determines how the 1,000 people were chosen, the 60% is a point estimate, and the ±3% reflects the confidence interval around it.
Which tools should you learn?
Statisticians and data analysts use specialized software. The main options are:
| Tool | Type | Best for | Cost |
|---|---|---|---|
| R | Programming language | Statistical analysis, academic research, visualization | Free |
| Python | Programming language | Data science, machine learning, general-purpose analysis | Free |
| SPSS | GUI software | Social sciences, users who prefer point-and-click | Paid |
| Stata | GUI + scripting | Economics, public health, panel data | Paid |
| Excel | Spreadsheet | Quick summaries, small datasets, non-technical users | Paid |
💡 Which one should you start with?
ℹ️ Free resources to learn R and Python
Once you understand what statistics is, the next step is learning the tools to apply it. Here are our free resources:
- R CODER: learn R from scratch with practical tutorials.
- R CHARTS: data visualization with base R and ggplot2.
- R PACKAGES: browse all official R packages with clean documentation.
- PYTHON CHARTS: data visualization with matplotlib, seaborn, and plotly.

