Population, individuals, census and sample
Before running any statistical analysis, you need to be clear about who or what you are studying. Population, individual, census and sample are the four basic concepts that define the scope of any study.
Population and individuals
A population is the complete set of elements sharing one or more characteristics that you want to study. It does not have to mean people: a population can be a batch of manufactured parts, all the transactions processed by a bank on a given day, or all the plants of a species in a forest.
An individual is each single element that belongs to that population. Every measurement you take comes from one individual.
- You want to study the average monthly salary of software engineers in Germany. The population is all software engineers currently employed in Germany. Each engineer is an individual.
- A food company wants to check the sugar content of its yogurt production. The population is all yogurt units produced in a given batch. Each unit is an individual.
- A biologist studies the weight of adult male lions in the Serengeti. The population is all adult male lions living there. Each lion is an individual.
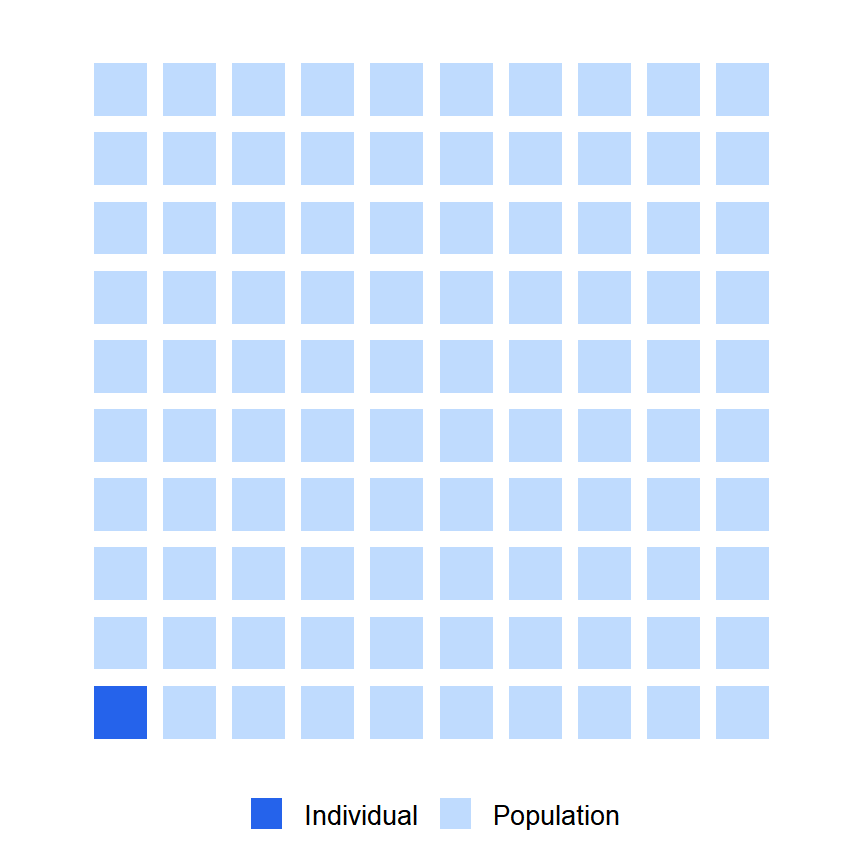
Figure 1: Each square represents one individual. The highlighted one is the individual being studied.
Why not always study the whole population?
In theory, the most reliable way to learn about a population is to measure every single individual. In practice, this is rarely feasible for three main reasons:
- Cost: surveying every adult in a country to estimate unemployment takes months and costs millions.
- Time: by the time you finish measuring everyone, the situation may have already changed.
- Destructive measurement: if you want to test how many hours a light bulb lasts, you have to run it until it burns out. You cannot test every bulb and still have bulbs to sell.
In all these situations the solution is the same: take a sample.
💡 The key idea
Sample and census
If the data collection covers the entire population, it is called a census. The most familiar example is the national census, where governments attempt to count and collect information on every resident of a country. Useful, but expensive and slow.
A sample is a subset of individuals selected from the population. The number of individuals in the sample is the sample size, denoted \(n\). For a variable \(X\), a sample of size \(n\) is written as:
\[\{x_1, x_2, \ldots, x_n\}\]
The goal of sampling is not just to collect data from fewer people. It is to collect data from fewer people in a way that still lets you draw accurate conclusions about the whole population.
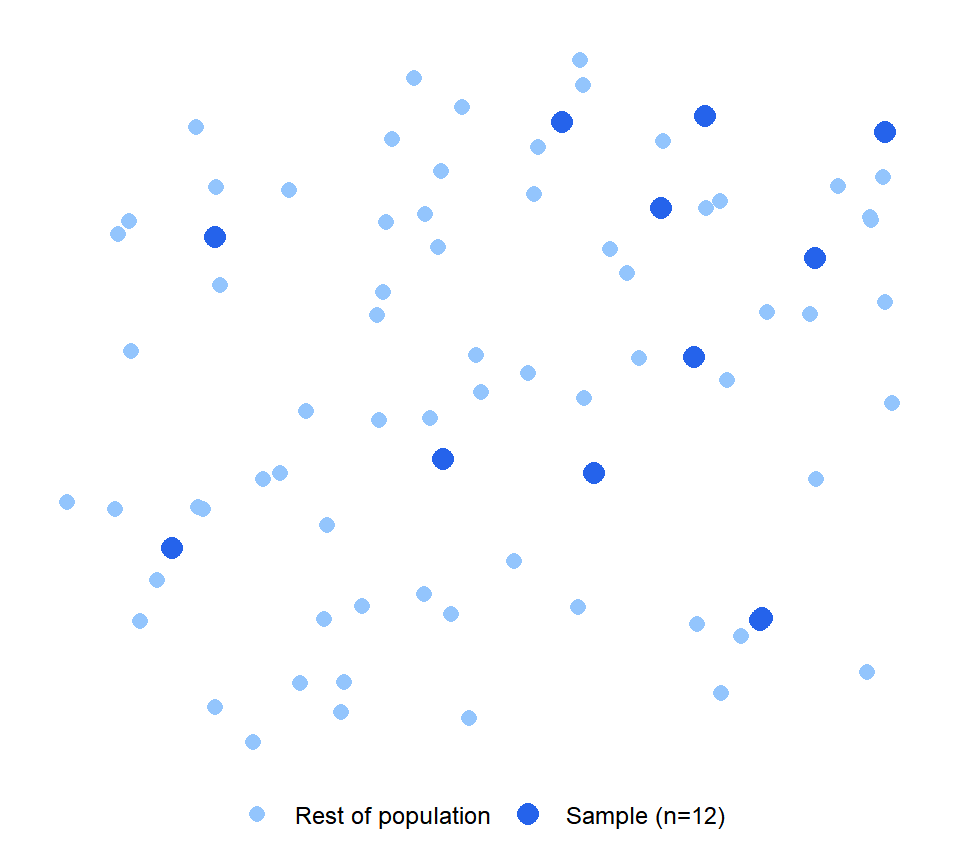
Figure 2: Census covers the entire population; a sample covers a representative subset
Biased samples
A sample is biased when it does not represent the population fairly. The conclusions you draw from a biased sample can be not just imprecise, but systematically wrong every time.
The most common sources of bias are:
- Selection bias: some individuals are more likely to end up in the sample than others. If you survey customer satisfaction only among people who contacted support, you miss all the satisfied customers who never had a problem.
- Non-response bias: some people refuse to participate. If those who decline are systematically different from those who respond, the sample no longer represents the population.
- Survivorship bias: you only observe the individuals that passed some filter. Studying only successful startups to learn what makes a business succeed ignores all the failed ones that followed the same strategy.
⚠️ A famous example of biased sampling
In the 1936 US presidential election, the Literary Digest magazine polled 2.4 million people and predicted a landslide victory for Alf Landon over Franklin D. Roosevelt. Roosevelt won by a large margin. The problem: the magazine sampled from its own subscribers, telephone directories, and car registration lists, which in 1936 skewed heavily toward wealthier, Republican-leaning voters. A massive sample size did not compensate for a biased sampling method.
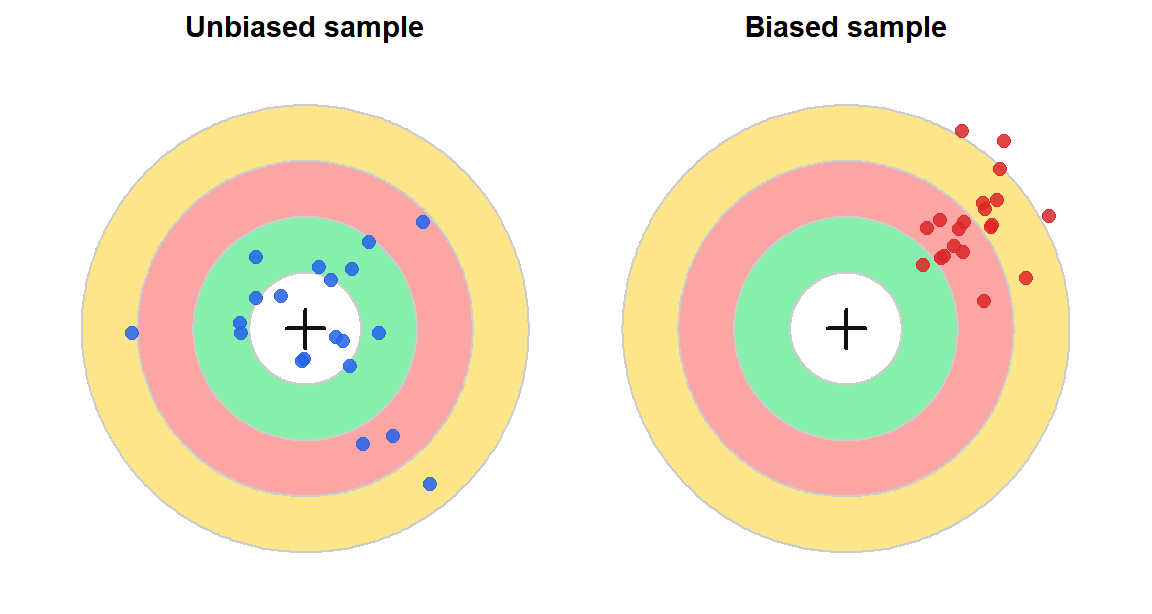
Figure 3: Left: unbiased sample (scattered but centered on the true value). Right: biased sample (consistently off-target).
Sampling methods
The process used to select individuals from the population is called a sampling method. Choosing the right method is as important as choosing the right statistical test later.
When sampling is based on probability, every individual has a known, non-zero chance of being selected. The most common probabilistic methods are:
- Simple random sampling: every individual has the same probability of being selected.
- Stratified sampling: the population is divided into groups (strata) and a random sample is taken from each. Useful when the population has distinct subgroups you want to represent proportionally.
- Cluster sampling: entire clusters are randomly selected. More practical when individuals are geographically spread out.
- Systematic sampling: you select every \(k\)-th individual from a list.
You can find a detailed explanation of each method in the sampling methods section.
The characteristics measured on the individuals are called variables, represented with uppercase letters such as \(X\) or \(Y\). These variables can be qualitative or quantitative depending on the type of values they take.

