Paired t-test
The paired t-test compares two related measurements by computing the difference for each subject and applying a one-sample t-test to those differences. By eliminating between-subject variability, it is more powerful than the two-sample t-test when the pairing is effective.
Why paired analysis?
When the same subjects are measured twice (before/after, left/right, two treatments in crossover), the two observations within each pair are correlated. A two-sample t-test ignores this correlation and includes between-subject variability in the standard error, making it harder to detect the treatment effect.
The paired t-test computes \(d_i = X_{i,2} - X_{i,1}\) for each subject and tests \(H_0: \mu_d = 0\) using a one-sample t-test on the \(d_i\). Between-subject variability disappears from the analysis.
Hypotheses
| Test | \(H_0\) | \(H_1\) |
|---|---|---|
| Two-sided | \(\mu_d = 0\) | \(\mu_d \neq 0\) |
| One-sided right | \(\mu_d = 0\) | \(\mu_d > 0\) |
| One-sided left | \(\mu_d = 0\) | \(\mu_d < 0\) |
More generally, the test can evaluate \(H_0: \mu_d = \delta_0\) for any hypothesized difference \(\delta_0\) (commonly 0).
Test statistic
Given \(n\) pairs with differences \(d_i = X_{i,2} - X_{i,1}\):
\[\bar{d} = \frac{1}{n}\sum d_i, \qquad S_d = \sqrt{\frac{\sum(d_i - \bar{d})^2}{n-1}}\]
\[t = \frac{\bar{d} - \delta_0}{S_d / \sqrt{n}}\]
Under \(H_0\), \(t \sim t(n-1)\). This is identical to the one-sample t-test formula applied to the differences.
⚠️ Analyzing paired data as independent samples wastes power
If you apply a two-sample t-test to paired data, the standard error includes between-subject variability that cancels out in the paired analysis. The result is a wider CI and a less significant p-value, potentially missing a real effect.
The reverse error also exists: treating independent samples as paired (by arbitrarily matching observations) is also wrong and inflates the degrees of freedom. Always match your analysis to your study design.
Examples
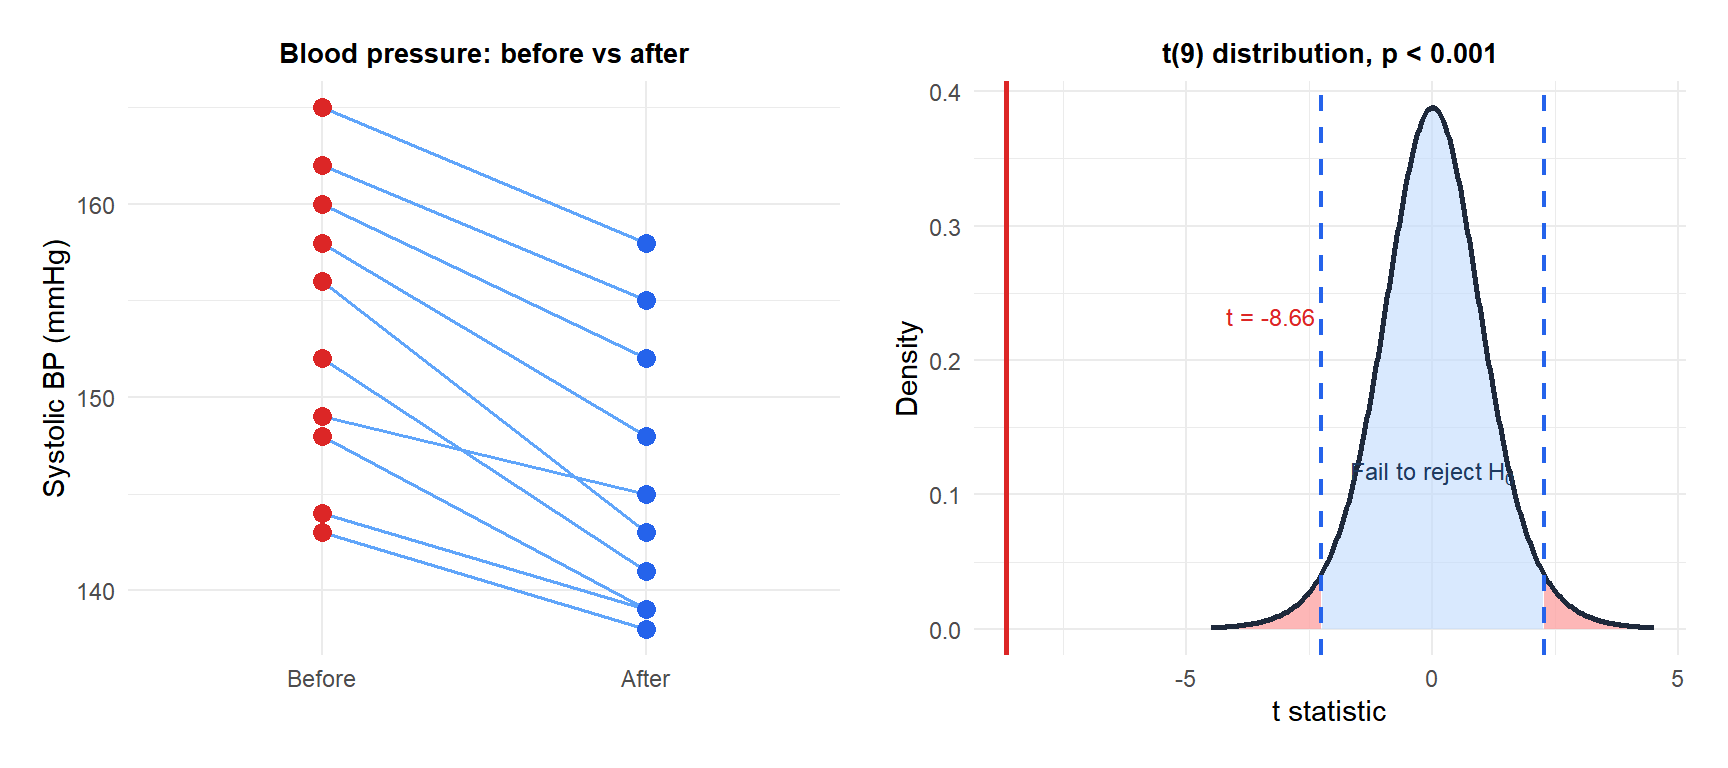
Example 1: blood pressure before and after medication (two-sided)
Ten patients have their systolic blood pressure measured before and after 4 weeks of treatment:
| Patient | Before | After | \(d_i\) |
|---|---|---|---|
| 1 | 152 | 141 | -11 |
| 2 | 148 | 139 | -9 |
| 3 | 165 | 158 | -7 |
| 4 | 143 | 138 | -5 |
| 5 | 156 | 143 | -13 |
| 6 | 160 | 152 | -8 |
| 7 | 149 | 145 | -4 |
| 8 | 158 | 148 | -10 |
| 9 | 144 | 139 | -5 |
| 10 | 162 | 155 | -7 |
\(\bar{d} = -7.9\) mmHg, \(S_d = 2.88\) mmHg.
Test statistic:
\[t = \frac{-7.9 - 0}{2.88/\sqrt{10}} = \frac{-7.9}{0.911} \approx -8.673\]
p-value (two-sided, \(df = 9\)): \(p = 2 \times P(T_9 \leq -8.673) < 0.001\).
Decision: reject \(H_0\). The medication significantly reduces blood pressure.
Example 2: new training program (one-sided right)
Eight employees complete a performance assessment before and after a training program. Scores (after - before): \(+8, +5, +12, +3, +9, +6, +4, +7\).
\(\bar{d} = 6.75\), \(S_d = 2.87\).
Hypotheses: \(H_0: \mu_d = 0\) vs \(H_1: \mu_d > 0\) (training improves scores).
Test statistic:
\[t = \frac{6.75}{2.87/\sqrt{8}} = \frac{6.75}{1.015} \approx 6.650\]
p-value (one-sided right, \(df = 7\)): \(p = P(T_7 \geq 6.650) < 0.001\).
Decision: reject \(H_0\). The training program significantly improved performance scores.
Power gain from pairing
The paired t-test is more powerful than the two-sample t-test when the within-subject correlation is positive (i.e., subjects who score high before also tend to score high after). The variance of the differences is:
\[\text{Var}(d_i) = \sigma_1^2 + \sigma_2^2 - 2\rho\sigma_1\sigma_2\]
When \(\rho > 0\), \(\text{Var}(d_i) < \sigma_1^2 + \sigma_2^2\), which is what the two-sample t-test uses. The higher the within-subject correlation, the greater the power advantage of the paired design.
Running the test in R
before <- c(152, 148, 165, 143, 156, 160, 149, 158, 144, 162)
after  <- c(141, 139, 158, 138, 143, 152, 145, 148, 139, 155)

# Paired t-test
t.test(after, before, paired = TRUE, alternative = "two.sided")

# Equivalent: one-sample t-test on differences
t.test(after - before, mu = 0, alternative = "two.sided")
Both calls give identical results. The output includes \(\bar{d}\), \(t\), \(df\), p-value, and a 95% CI for \(\mu_d\).
💡 When to use the paired t-test
Use the paired t-test when:
- The same subjects are measured twice (before/after, two conditions).
- Subjects are matched by design (twins, matched case-control).
- Each observation in group 1 is naturally linked to one in group 2.
Use the two-sample t-test (Welch) when subjects in the two groups are different and there is no natural pairing. If in doubt: can you meaningfully compute \(d_i = X_{i,2} - X_{i,1}\) for each unit? If yes, use paired.

