Kruskal-Wallis test
The Kruskal-Wallis test is the nonparametric alternative to one-way ANOVA. It replaces the raw observations with their ranks and tests whether the rank distributions are the same across all groups. It requires no normality assumption and is robust to outliers and skewed distributions.
When to use Kruskal-Wallis instead of ANOVA
Use the Kruskal-Wallis test when:
- The data are clearly non-normal and sample sizes are small (so the CLT does not help).
- The data are ordinal (e.g., Likert scales, rankings).
- There are extreme outliers that would distort the ANOVA F-statistic.
- Levene’s test rejects homoscedasticity and Welch’s ANOVA is also not appropriate.
When sample sizes are large and data are continuous, one-way ANOVA (or Welch’s ANOVA) is usually preferable due to higher power.
Hypotheses
\(H_0\): all \(k\) groups have the same distribution (equivalently, the same population median).
\(H_1\): at least one group has a different distribution.
⚠️ Kruskal-Wallis tests distributions, not just medians
A common description says the Kruskal-Wallis test compares medians. This is only accurate when the groups have the same distributional shape and differ only in location. In general, the test is sensitive to any difference in distribution (location, spread, shape). A significant result means the groups differ in some way, but not necessarily in their medians. Interpret results carefully when groups have very different shapes or variances.
Test statistic
Combine all \(N = n_1 + n_2 + \cdots + n_k\) observations and rank them from 1 to \(N\) (average ranks for ties). Let \(R_{ij}\) be the rank of the \(j\)-th observation in group \(i\), and \(\bar{R}_i = \frac{1}{n_i}\sum_j R_{ij}\) the mean rank in group \(i\).
\[H = \frac{12}{N(N+1)} \sum_{i=1}^{k} n_i \left(\bar{R}_i - \frac{N+1}{2}\right)^2\]
Under \(H_0\), \(H\) follows approximately a \(\chi^2\) distribution with \(k-1\) degrees of freedom (exact for large samples). The larger \(H\) is, the more the rank distributions differ across groups.
With ties, a correction factor is applied: \(H_\text{corrected} = H / C\) where \(C = 1 - \sum_t(t^3-t)/(N^3-N)\) and \(t\) is the size of each tied group. For few ties the correction is negligible.
Complete example
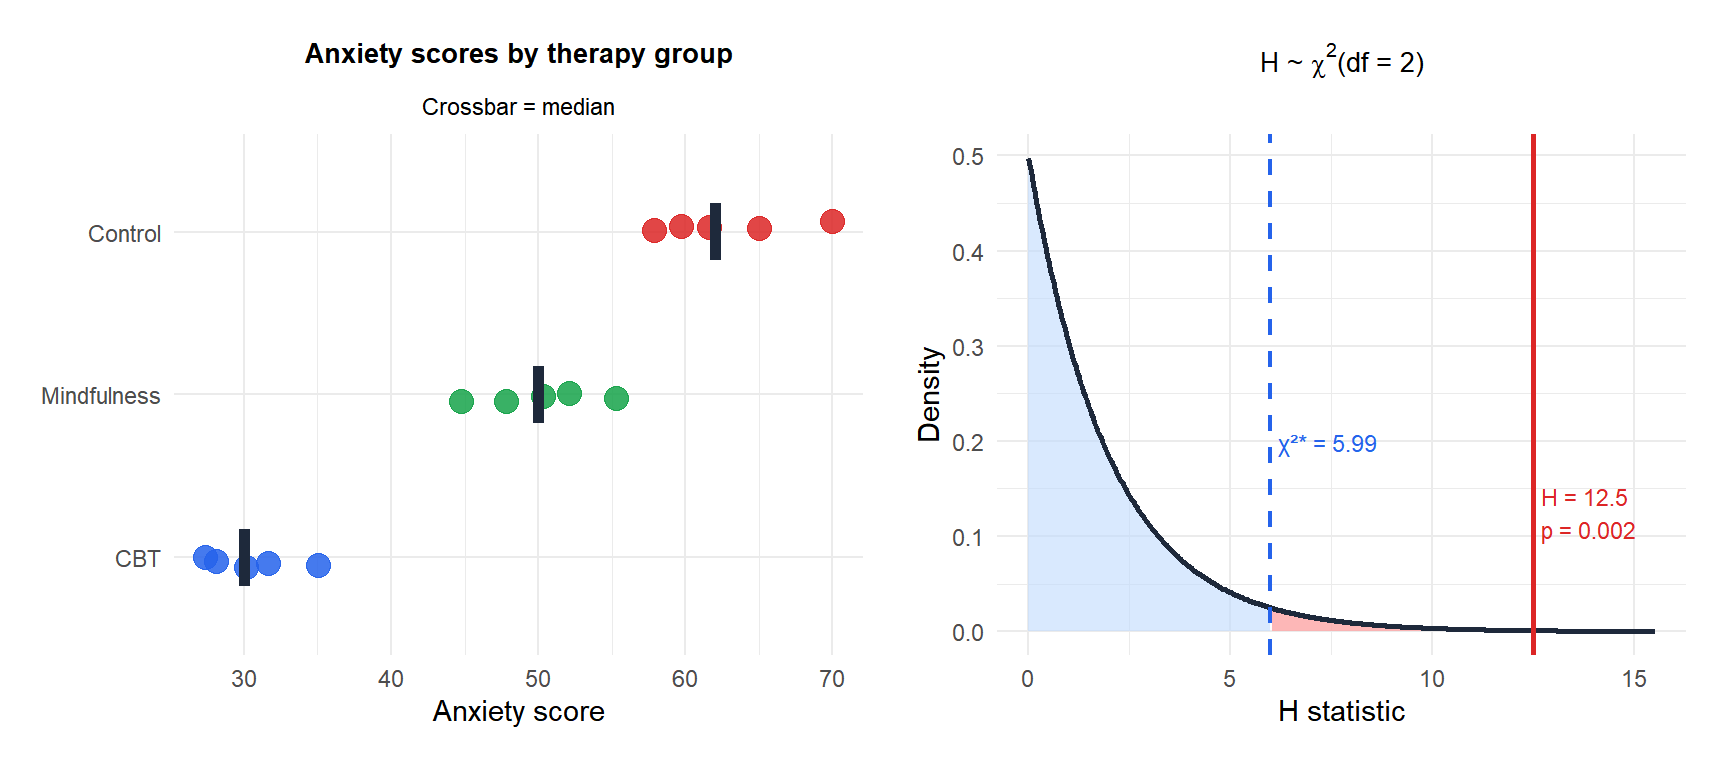
A psychologist measures anxiety scores (0-100) in three therapy groups after 8 weeks:
- Group A (CBT): 32, 28, 35, 30, 27
- Group B (Mindfulness): 45, 52, 48, 55, 50
- Group C (Control): 60, 58, 65, 62, 70
Step 1: rank all 15 observations together.
| Score | 27 | 28 | 30 | 32 | 35 | 45 | 48 | 50 | 52 | 55 | 58 | 60 | 62 | 65 | 70 |
|---|---|---|---|---|---|---|---|---|---|---|---|---|---|---|---|
| Rank | 1 | 2 | 3 | 4 | 5 | 6 | 7 | 8 | 9 | 10 | 11 | 12 | 13 | 14 | 15 |
| Group | A | A | A | A | A | B | B | B | B | B | C | C | C | C | C |
Step 2: mean ranks. \(\bar{R}_A = (1+2+3+4+5)/5 = 3\), \(\bar{R}_B = (6+7+8+9+10)/5 = 8\), \(\bar{R}_C = (11+12+13+14+15)/5 = 13\).
Overall mean rank: \((N+1)/2 = 16/2 = 8\).
Step 3: compute \(H\).
\[H = \frac{12}{15 \times 16}\left[5(3-8)^2 + 5(8-8)^2 + 5(13-8)^2\right]\] \[= \frac{12}{240}\left[5 \times 25 + 0 + 5 \times 25\right] = 0.05 \times 250 = 12.50\]
p-value (\(\chi^2\) with \(df = 2\)): \(p = P(\chi^2_2 \geq 12.50) \approx 0.002\).
Decision: reject \(H_0\). The three therapy groups differ significantly in anxiety scores.
Post-hoc tests: Dunn’s test
Like ANOVA, a significant Kruskal-Wallis result only says some groups differ. Dunn’s test performs pairwise comparisons using the rank sums from the original test, with a correction for multiple comparisons (typically Bonferroni or Holm).
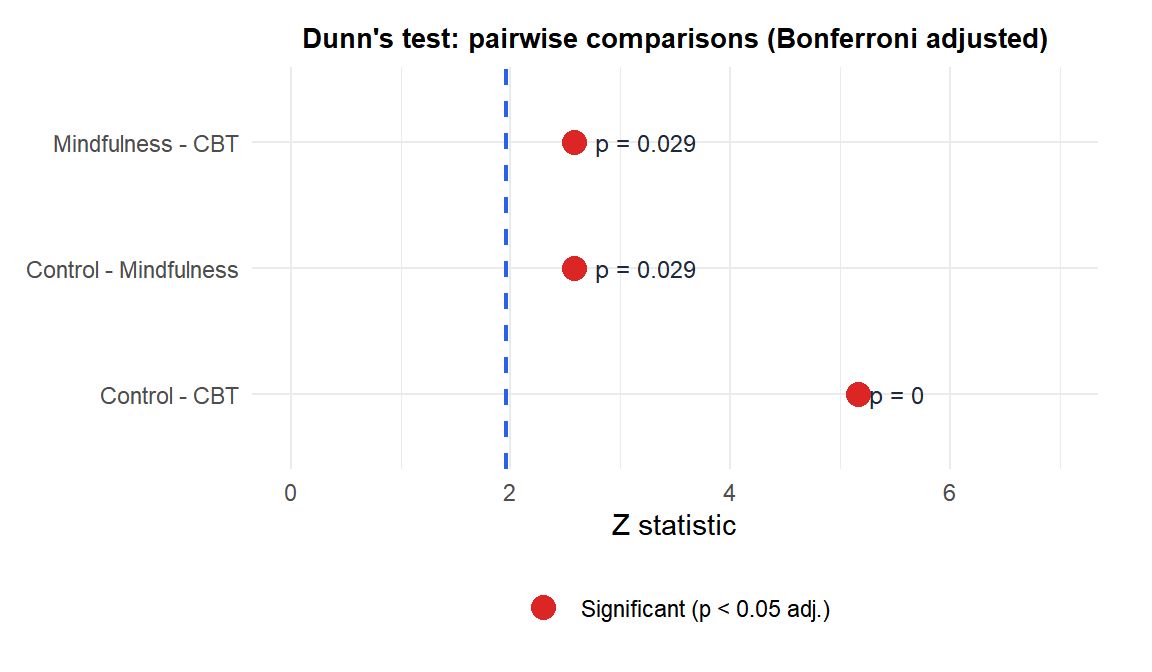
All three pairs differ significantly after Bonferroni adjustment. CBT produces the lowest anxiety scores, followed by Mindfulness, then Control.
Running the test in R
# Kruskal-Wallis test
kruskal.test(score ~ group, data = df_anx)

# Dunn's post-hoc test with Bonferroni correction
library(dunn.test)
dunn.test(df_anx$score, df_anx$group, method = "bonferroni")

# Or with the FSA package (Holm correction)
library(FSA)
dunnTest(score ~ group, data = df_anx, method = "holm")
💡 Kruskal-Wallis vs one-way ANOVA: efficiency
When the normality assumption holds, the Kruskal-Wallis test has about 95.5% of the power of one-way ANOVA (the same asymptotic relative efficiency as the Wilcoxon vs t-test). For non-normal distributions, Kruskal-Wallis can be substantially more powerful. The cost of using Kruskal-Wallis when ANOVA is valid is small; the cost of using ANOVA when Kruskal-Wallis is needed can be large.

