Range in statistics
The range is the simplest measure of dispersion: just the difference between the largest and smallest values in a dataset. It is easy to compute and easy to interpret, but it has a critical weakness that makes it unreliable in many real situations.
Definition
The range \(R\) of a dataset \(X\) with \(n\) observations is:
\[ R = \max(X) - \min(X) \]
It measures the total spread of the data from one extreme to the other.
Properties
- Non-negative: \(R \geq 0\). It equals zero only when all values are identical.
- Sensitive to outliers: a single extreme value completely changes the range, regardless of how the rest of the data is distributed.
- Only uses two values: the range ignores everything between the minimum and maximum. Two datasets with very different distributions can have the exact same range.
- Scale transformation: if \(Y = aX + b\) with \(a > 0\), then \(R(Y) = a \cdot R(X)\). Adding a constant does not change the range.
⚠️ The range tells you nothing about what is in between
Consider these two datasets:
- \(A = (1, 1, 1, 1, 1, 1, 1, 1, 1, 100)\)
- \(B = (1, 12, 23, 34, 45, 56, 67, 78, 89, 100)\)
Both have a range of 99. But dataset A has 9 values clustered at 1 with one extreme outlier, while dataset B is uniformly spread across the range. The range cannot distinguish between these two very different situations.
Examples
Example 1: daily temperature range
A weather station records the following hourly temperatures (°C) over one day:
\[x = (12, 14, 15, 18, 22, 26, 28, 27, 24, 20, 17, 13)\]
The range is: \(R = 28 - 12 = 16°C\).
This tells you that temperatures varied by 16 degrees throughout the day, which is immediately useful for deciding what to wear or how to plan outdoor activities.
Example 2: the outlier problem
A startup has 8 employees with the following annual salaries (in thousands of USD):
\[x = (32, 35, 36, 38, 40, 41, 42, 210)\]
The range is \(R = 210 - 32 = 178\), which suggests massive pay dispersion. But 7 out of 8 employees earn between 32k and 42k. The range of 178k is driven entirely by the CEO’s salary.
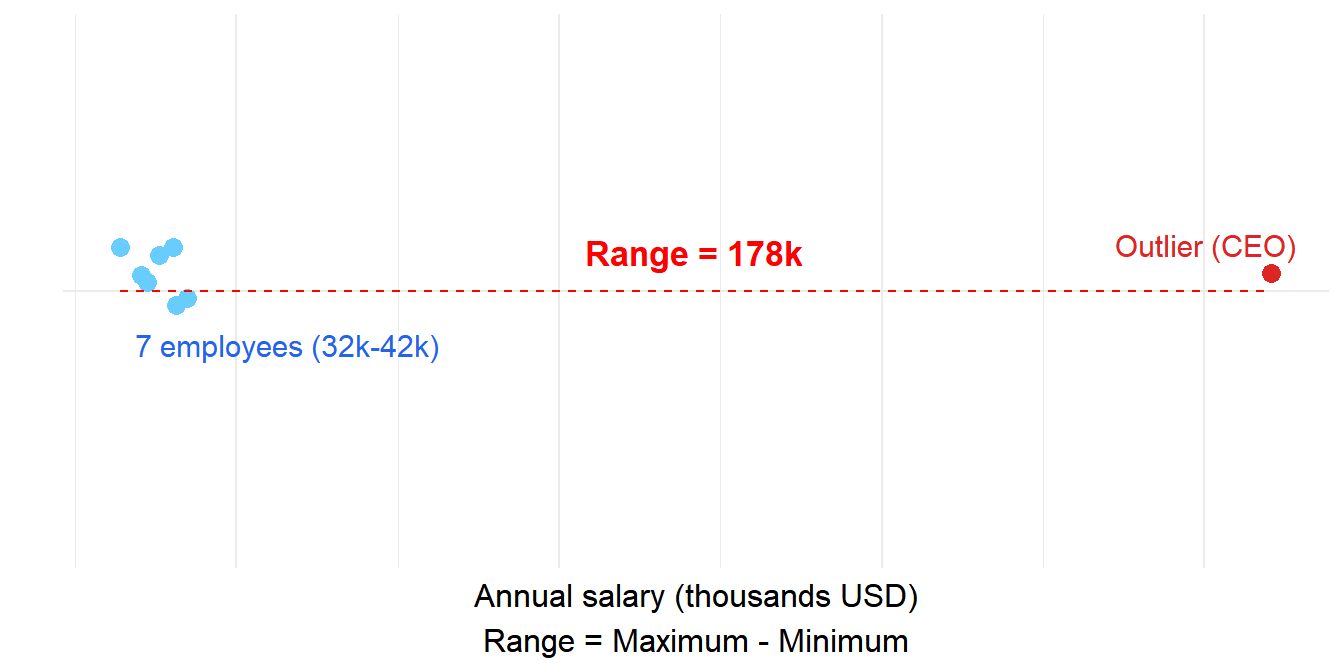
In this case, the interquartile range (IQR) would be a far more informative measure: it focuses on the central 50% of the data and ignores both extremes.
Example 3: same range, different distributions
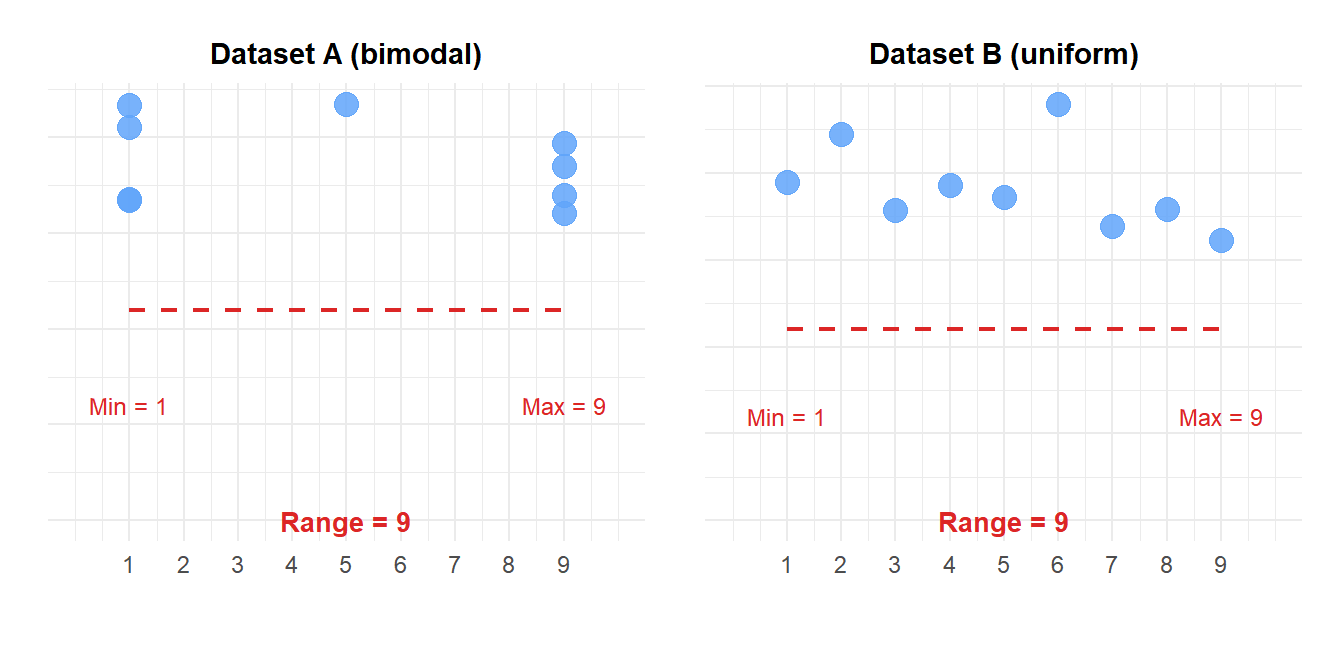
Figure 1: Both datasets have the same range (9), but completely different distributions
When to use the range
Despite its limitations, the range is useful in specific situations:
- Quick screening: when you need a fast, rough sense of how spread out the data is.
- Process control: in manufacturing and quality control, the range of small samples is used in control charts (called R-charts) to monitor process variability in real time.
- Natural bounds: when the minimum and maximum are themselves meaningful, such as the daily temperature range for a weather forecast, or the high-low price range in financial markets.
💡 Use the range alongside other measures

