Mode in statistics
The mode is the most frequently occurring value in a dataset. Unlike the mean and median, it works with any type of variable, including categories, and it is the only measure of central tendency that makes sense for nominal data.
Definition
The mode is the value or values that appear most often in a dataset. It is usually represented as \(Mo\).
A dataset can have more than one mode if several values share the highest frequency. Depending on the number of modes, the distribution is called:
- Unimodal: one mode.
- Bimodal: two modes.
- Multimodal: more than two modes.
A dataset with no repeated values has no mode.
ℹ️ The mode and variable types
The mode is the only measure of central tendency that can be used with all types of variables:
- Nominal: the most common category (e.g. the most frequent blood type in a sample).
- Ordinal: the most common rank (e.g. the most frequent satisfaction rating).
- Discrete quantitative: the most frequent count (e.g. the most common number of daily transactions).
- Continuous quantitative: requires estimating a density function and finding its maximum.
Properties
The mode has the following properties:
- Linear transformation: if \(Y = aX + b\), then \(Mo(Y) = a \cdot Mo(X) + b\).
- Robustness: the mode is not affected by outliers. An extreme value does not change which value appears most often.
- Non-uniqueness: a dataset can have zero, one, or multiple modes.
- Applicable to all variable types: the only central tendency measure that works with nominal data.
⚠️ The mode is not always defined
If no value repeats in a dataset, there is no mode. This is common with small samples of continuous data, where every observation is slightly different. In that case, you need to group the data into intervals or estimate the density to find the modal class.
Examples
Unimodal data
In the vector \(x = (1, 5, 1, 2, 1, 6, 7, 1)\), the value 1 appears four times, more than any other. The mode is \(Mo(x) = 1\).
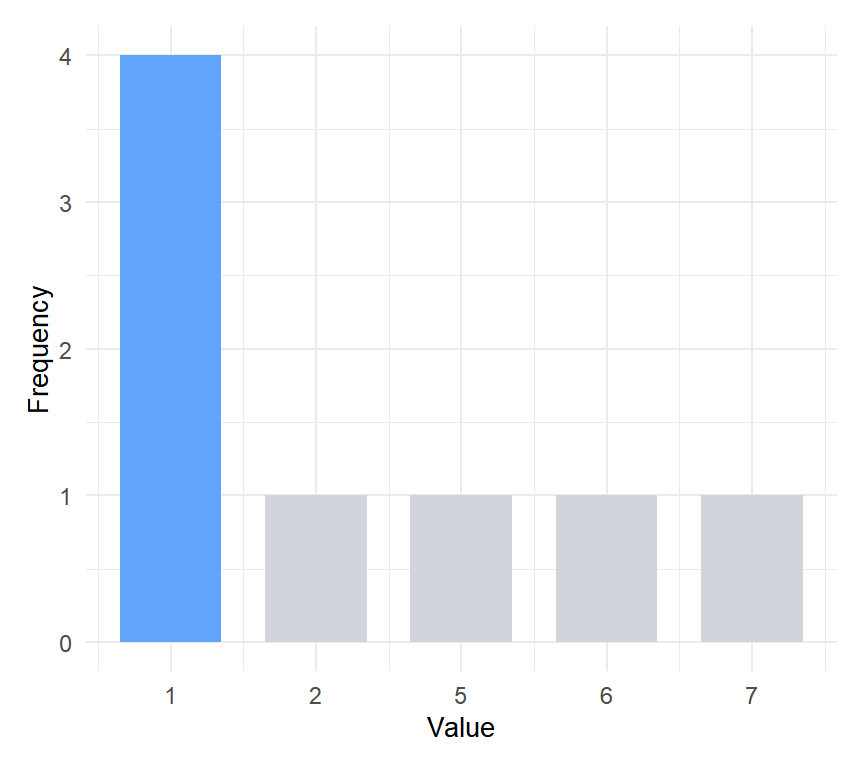
Figure 1: Unimodal distribution: value 1 is the mode (highlighted in blue)
Bimodal data
In the vector \(x = (1, 5, 1, 5, 2, 1, 6, 7, 1, 5, 5)\), both 1 and 5 appear four times. The dataset has two modes: \(Mo(x) = \{1, 5\}\).
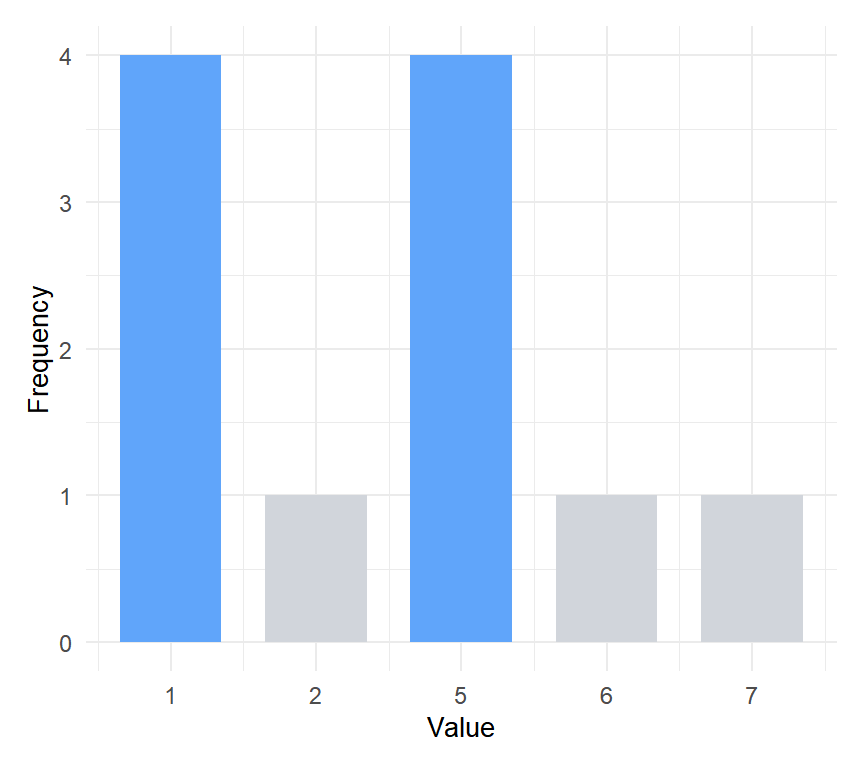
Figure 2: Bimodal distribution: values 1 and 5 share the highest frequency
Modes with unequal frequency
In the vector \(x = (1, 5, 1, 5, 2, 1, 6, 7, 1, 5)\), the value 1 appears 4 times and 5 appears 3 times. Strictly speaking, the only mode is 1. Whether you report one or two modes in borderline cases depends on the context and purpose of the analysis.
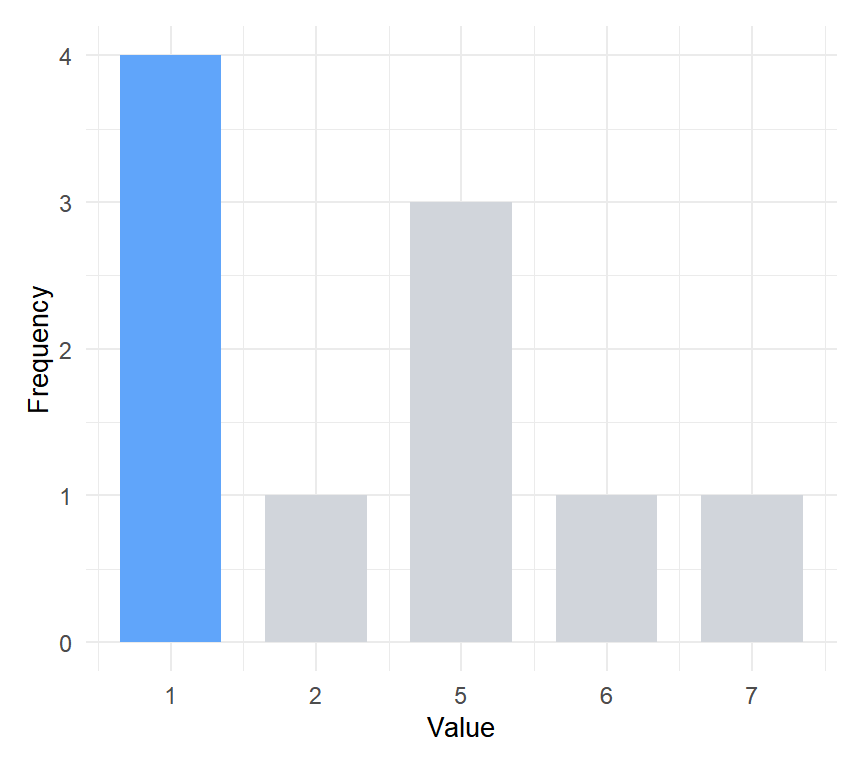
Figure 3: The value 1 has a higher frequency than 5, so strictly there is one mode
A real-world example
The mode is especially useful when the “most common value” matters more than the average. A shoe retailer does not care about the mean shoe size of its customers. It cares about the mode: which size to stock most of.
A sports shop records the shoe sizes sold in one week:
\[x = (38, 40, 42, 40, 41, 42, 40, 43, 42, 40, 41, 42)\]
Counting frequencies: size 40 appears 4 times, size 42 appears 4 times, the rest appear once or twice. The dataset is bimodal: \(Mo(x) = \{40, 42\}\).
The mean size would be approximately 41.1, which is not even a standard size. The mode is what the shop actually needs to plan inventory.
Mode in continuous data
For continuous variables, exact values rarely repeat, so the mode is estimated from a density curve. The mode is the value at which the density is highest, which corresponds to the peak of the distribution.
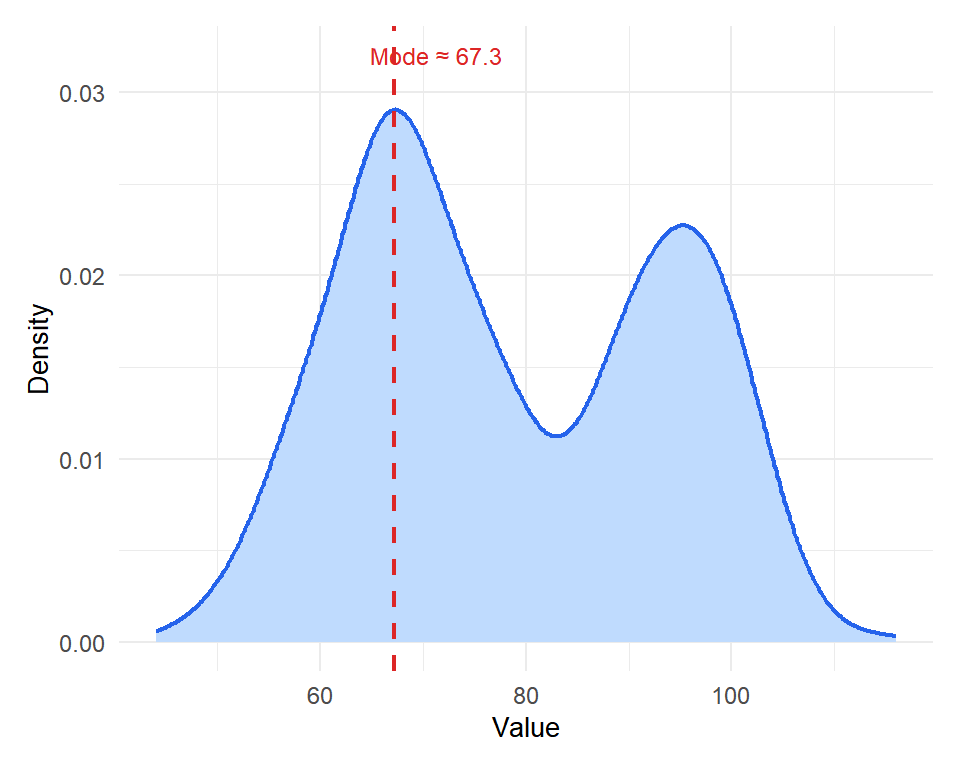
Figure 4: For continuous data, the mode is the peak of the density curve
💡 Bimodal distributions often reveal hidden subgroups
Limitations of the mode
- Not always defined: if no value repeats, there is no mode.
- Not always unique: multiple modes can make interpretation harder.
- Unstable in small samples: adding or removing a single observation can change the mode entirely. With small datasets, the mode is unreliable.
- Less informative for continuous data: without grouping or density estimation, every value may be unique.
⚠️ Do not confuse the mode with the most common answer in a survey
In a Likert scale survey (1 to 5), the mode is the most frequent response. But if 40% answer 4 and 35% answer 5, reporting only the mode (4) hides that most respondents are in the top two categories. Always look at the full frequency distribution, not just the mode.

